

Trading
Esplora una vasta gamma di mercati con prezzi competitivi, elevata liquidità e strumenti di trading avanzati.
Scopri di più 
Piattaforma
Fai trading senza problemi con la potente piattaforma di TMGM, fatta apposta per essere veloce, precisa e per darti un'esperienza di trading fantastica.
Scopri di più Piattaforma di trading
Strumenti di trading
Academy
Impara le basi del trading con le risorse per principianti, tra cui guide, webinar e approfondimenti sul mercato.
Scopri di più Notizie e analisi
Ricevi aggiornamenti sul mercato in tempo reale e analisi di esperti per cogliere le opportunità di trading
Scopri di più Notizie e analisi
Chi siamo
Scopri cosa rende TMGM speciale: la nostra presenza globale, la nostra forza normativa e il nostro impegno per l'innovazione nel trading.
Scopri di più Perché scegliere TMGM
Sponsorizzazioni
Ripple and Stellar outlook: XRP stalls at key resistance, XLM rally loses steam
- XRP faces rejection from the 50-day EMA at $1.18 after breaking above the upper boundary of the falling channel.
- XLM extends its pullback on Tuesday after a slight decline the previous day.
- Mixed on-chain and derivatives data suggest traders remain cautiously optimistic despite the ongoing price correction.
Ripple (XRP) and Stellar (XLM) are trading under pressure on Tuesday as bulls lose steam. XRP faces rejection near key resistance, while XLM continues its pullback so far this week. Despite the ongoing correction, mixed on-chain and derivatives metrics suggest traders remain cautiously optimistic for these altcoins.

Mixed sentiment among derivatives traders
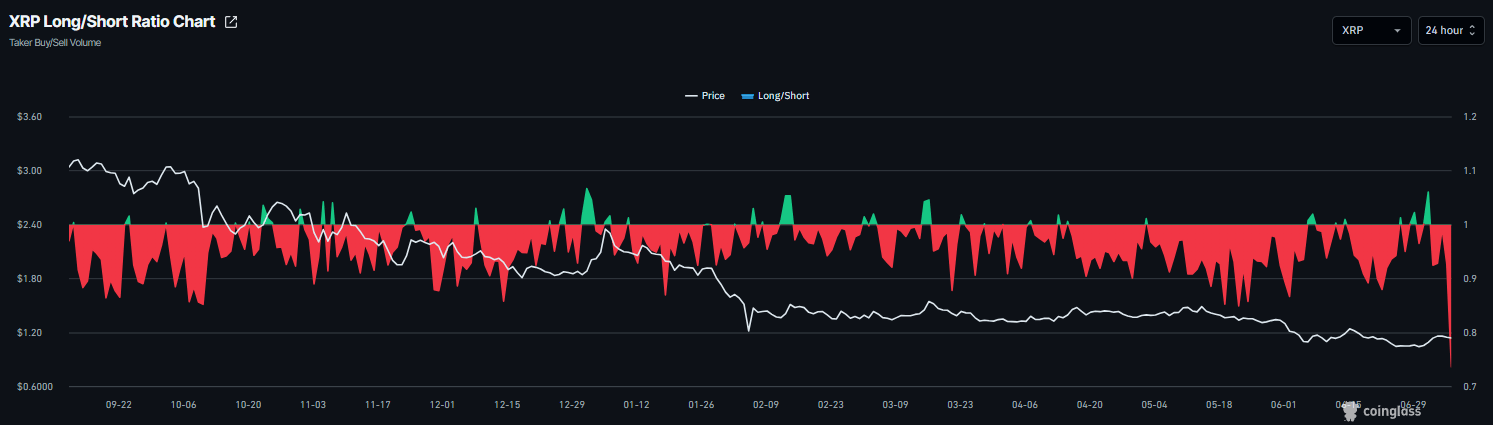
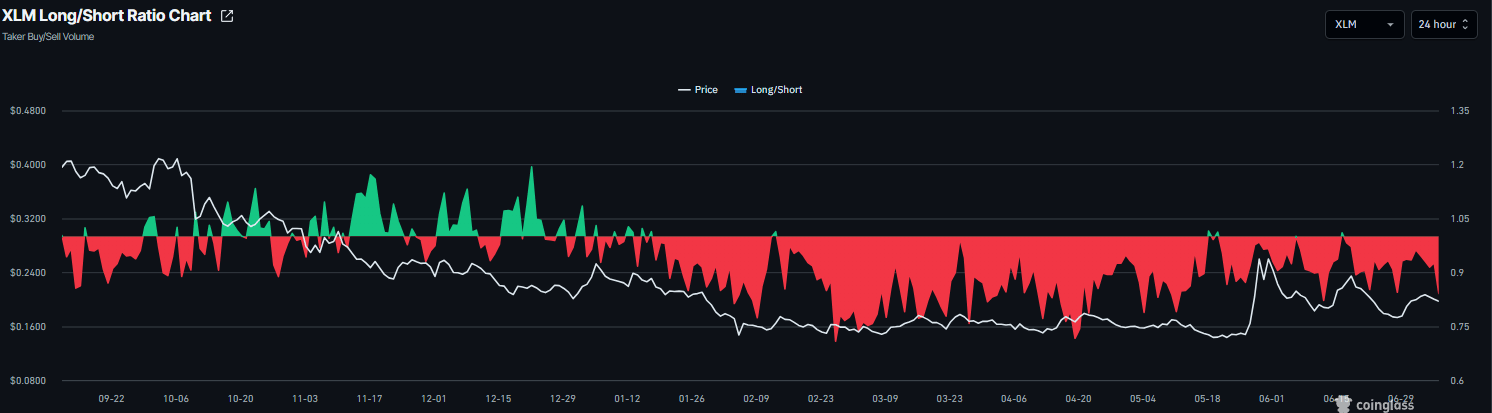
Derivatives data shows a mixed outlook. CoinGlass’ long-to-short ratio for XRP reads 0.73 on Tuesday, the lowest level over a month. During the same period, XLM's long-to-short ratio stands at 0.84, nearing the lowest level over a month. This ratio, being below 1, reflects bearish sentiment in the market, as more traders are betting the asset’s price will fall.
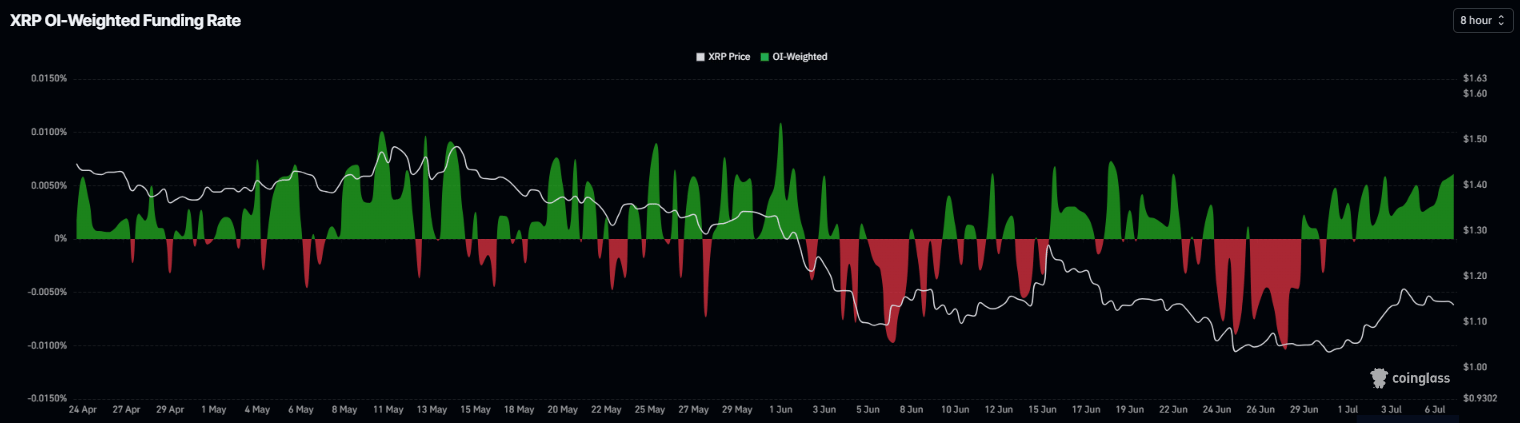
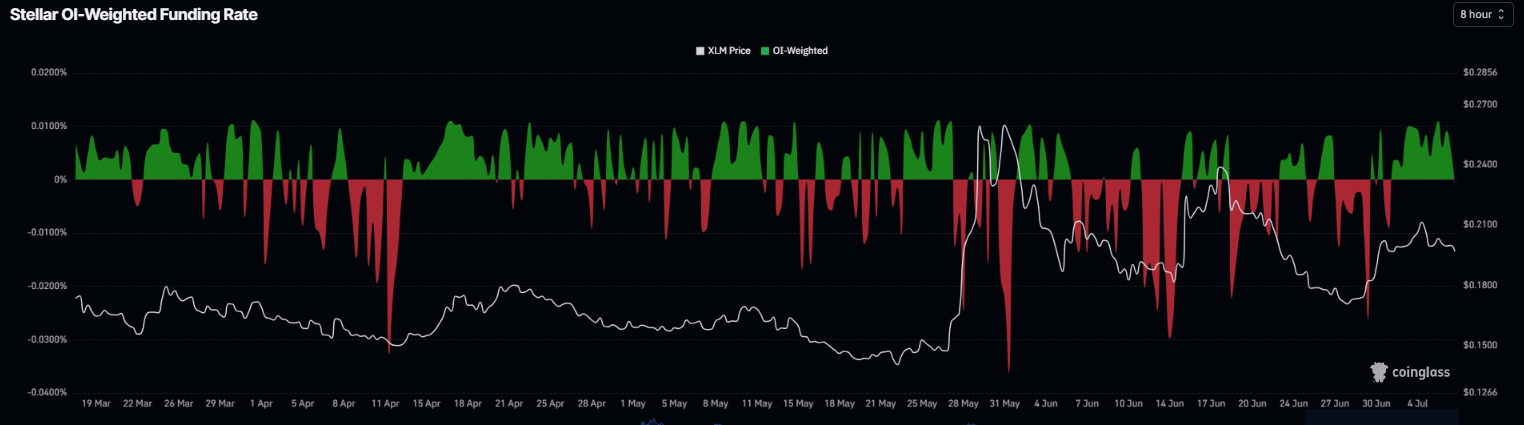
However, XRP and XLM funding rates remain positive, at 0.0061% and 0.0058%, respectively, on Tuesday. These positive rates indicate that longs are paying the shorts, suggesting bullish sentiment.
On-chain metrics show cautious optimism
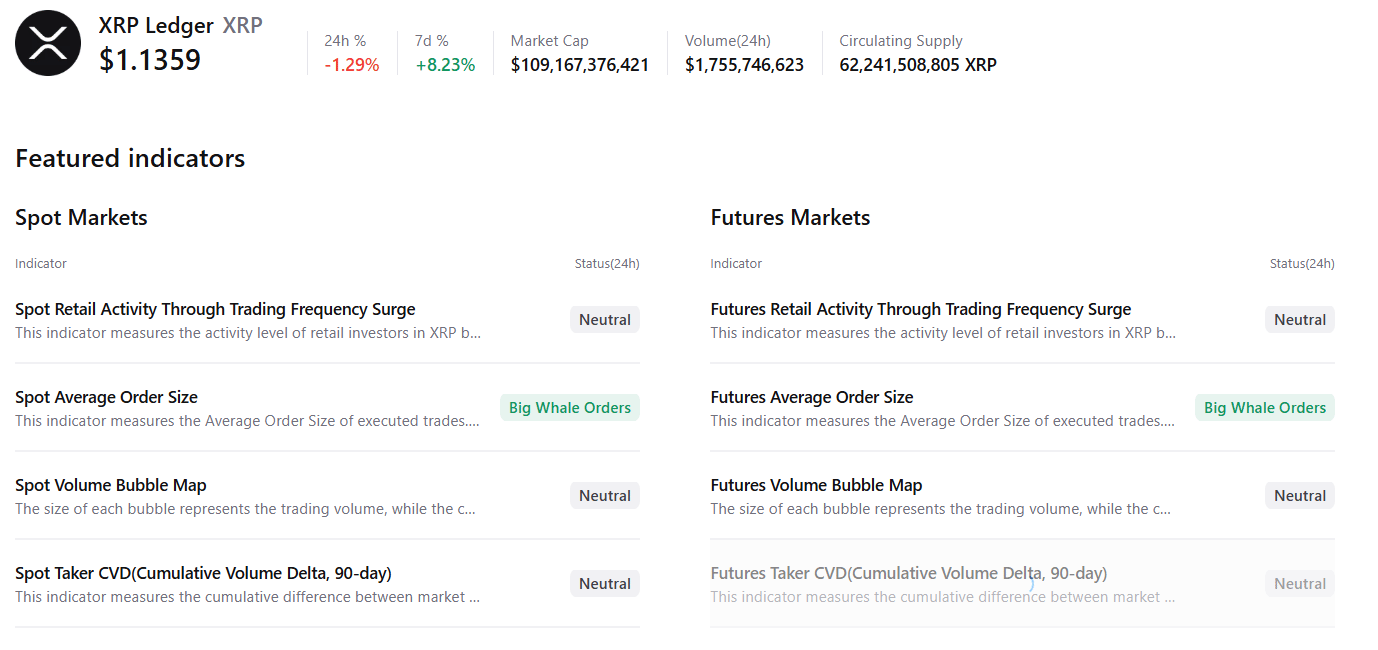
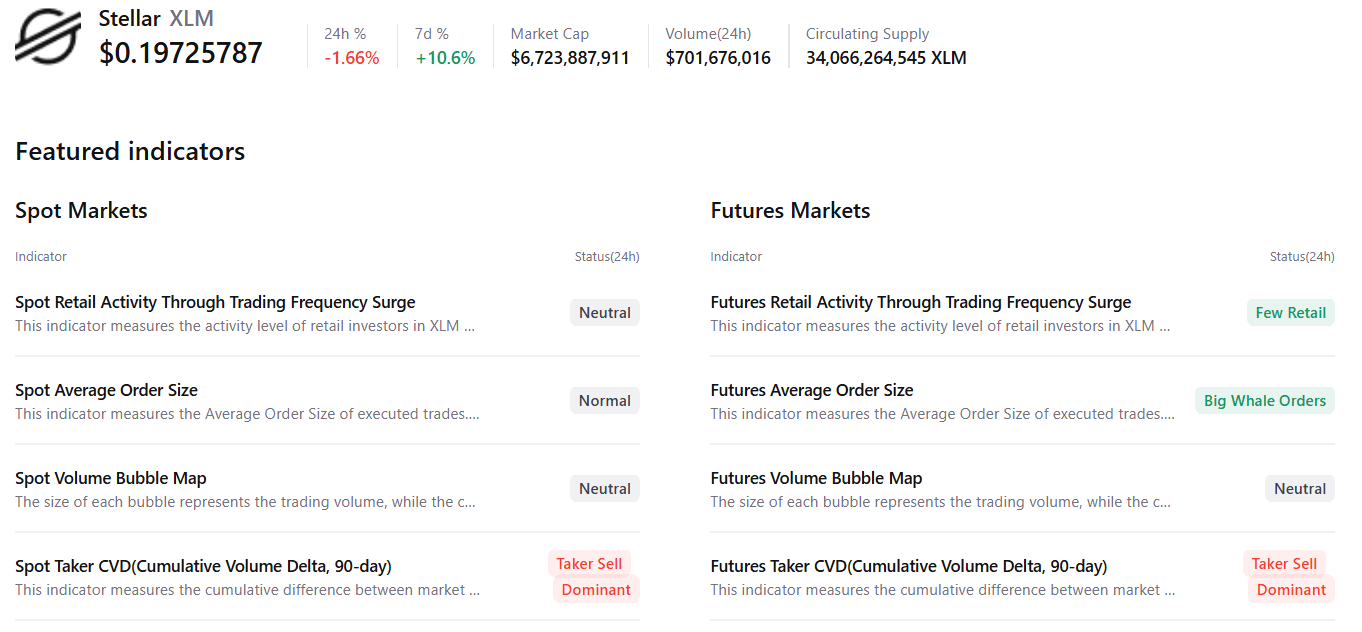
CryptoQuant’s summary data shows cautious optimism. XRP’s spot and futures markets show large-whale orders, with neutral conditions on other metrics, supporting a potential recovery. However, XLM shows selling-side dominance in both markets, with mixed retail activity and large-whale orders in the futures market, hinting at cautious sentiment among traders.
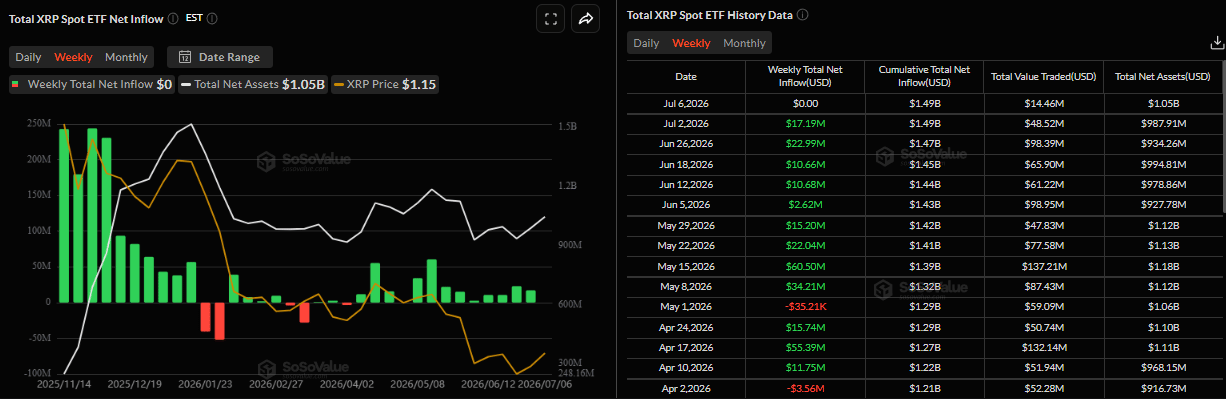
SoSoValue data shows institutional demand began the week with a neutral tone. Spot Exchange-Traded Funds (ETFs) were muted on Monday, following a net inflow of $17.19 million last week. If this inflow trend continues and intensifies this week, XRP could see a recovery ahead.
XRP technical outlook: Faces rejection from 50-day EMA
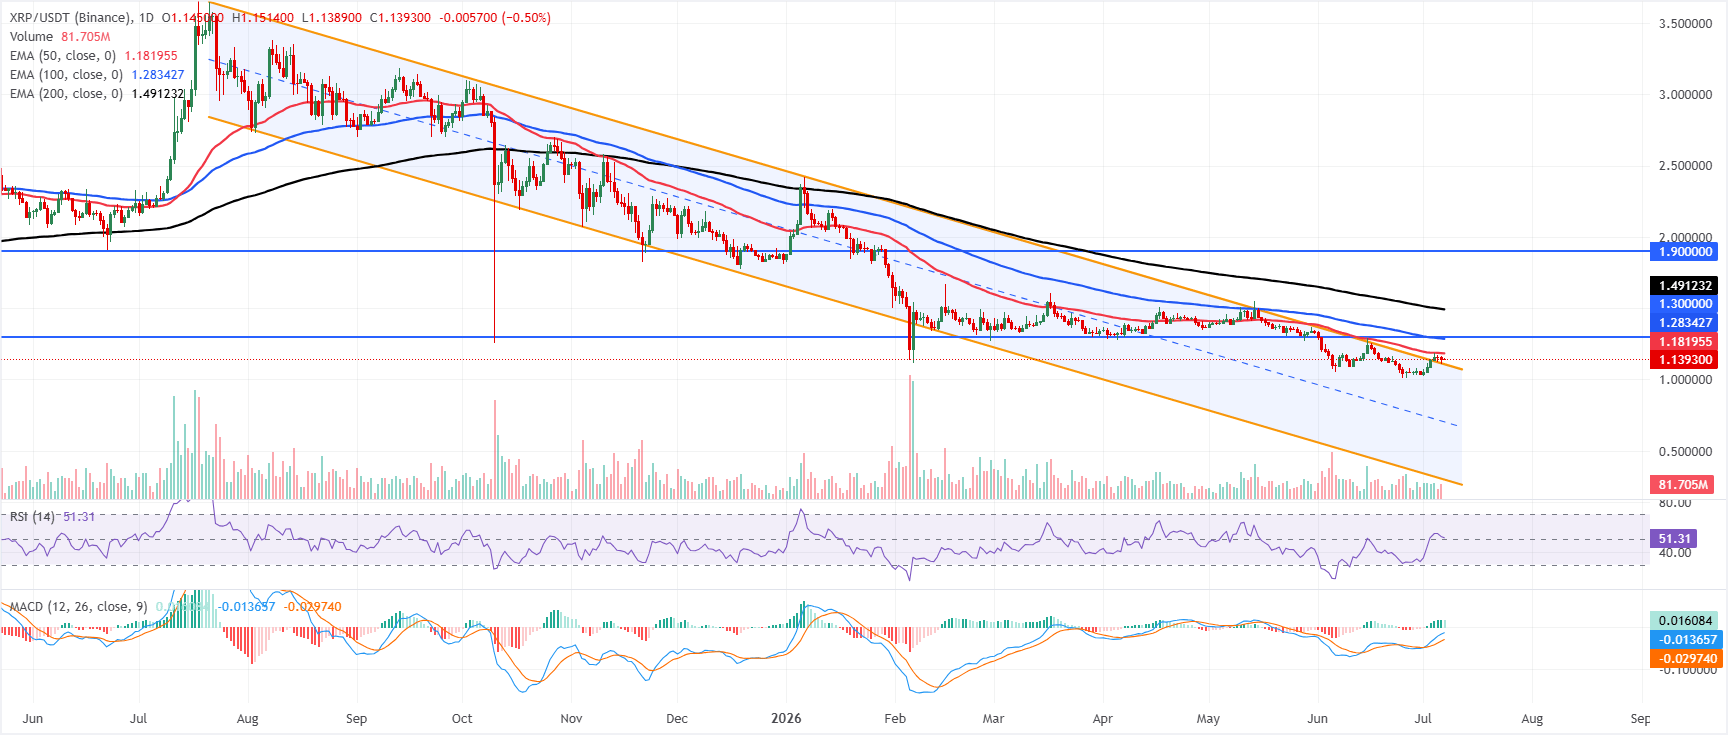
XRP price trades at $1.1393 on Tuesday, maintaining a bearish near-term tone as it remains below the 50-day Exponential Moving Average (EMA) at $1.1820, the 100-day EMA at $1.2834 and the longer-term 200-day EMA at $1.4912.
The downward parallel channel offers a modicum of structure, with price holding above its lower band around $1.1054, while the Relative Strength Index (RSI) hovers near a neutral 51, and the Moving Average Convergence Divergence (MACD) stays in positive territory but shows a slight loss of momentum, hinting at a capped recovery rather than a decisive trend reversal.
On the topside, immediate resistance emerges at the 50-day EMA at $1.1820, followed by the 100-day EMA at $1.2834 and the horizontal barrier at $1.3000, with the 200-day EMA at $1.4912 and the prior resistance line near $1.9000 marking higher hurdles for any sustained advance.
On the downside, initial support aligns with the lower boundary of the descending channel around $1.1054, and a clear break below this floor would reinforce the prevailing bearish bias and open the door to a deeper pullback in the coming sessions.
XLM technical outlook: Finds support around key levels
XLM price trades at $0.1978 on Tuesday, holding above the 50-day and 100-day EMAs at $0.1922 and $0.1872, reinforcing a mildly bullish near-term bias. The pair is still capped just underneath the 200-day EMA at $0.1985 and the 61.8% Fibonacci retracement at $0.2001, while the RSI around 51 and a positive MACD line above zero suggest steady but not overextended upside momentum.
On the topside, initial resistance is at the 200-day EMA at $0.1985, followed closely by the 61.8% Fibonacci retracement at $0.2001, with higher hurdles at $0.2188 and $0.2376 before the next Fibonacci barrier at $0.2607.
On the downside, immediate support is seen at the 50-day EMA at $0.1922, ahead of the 100-day EMA at $0.1872, while a horizontal level at $0.1774 and the 78.6% Fibonacci retracement at $0.1735 guard against a deeper pullback before the more distant structural floor near $0.1421.
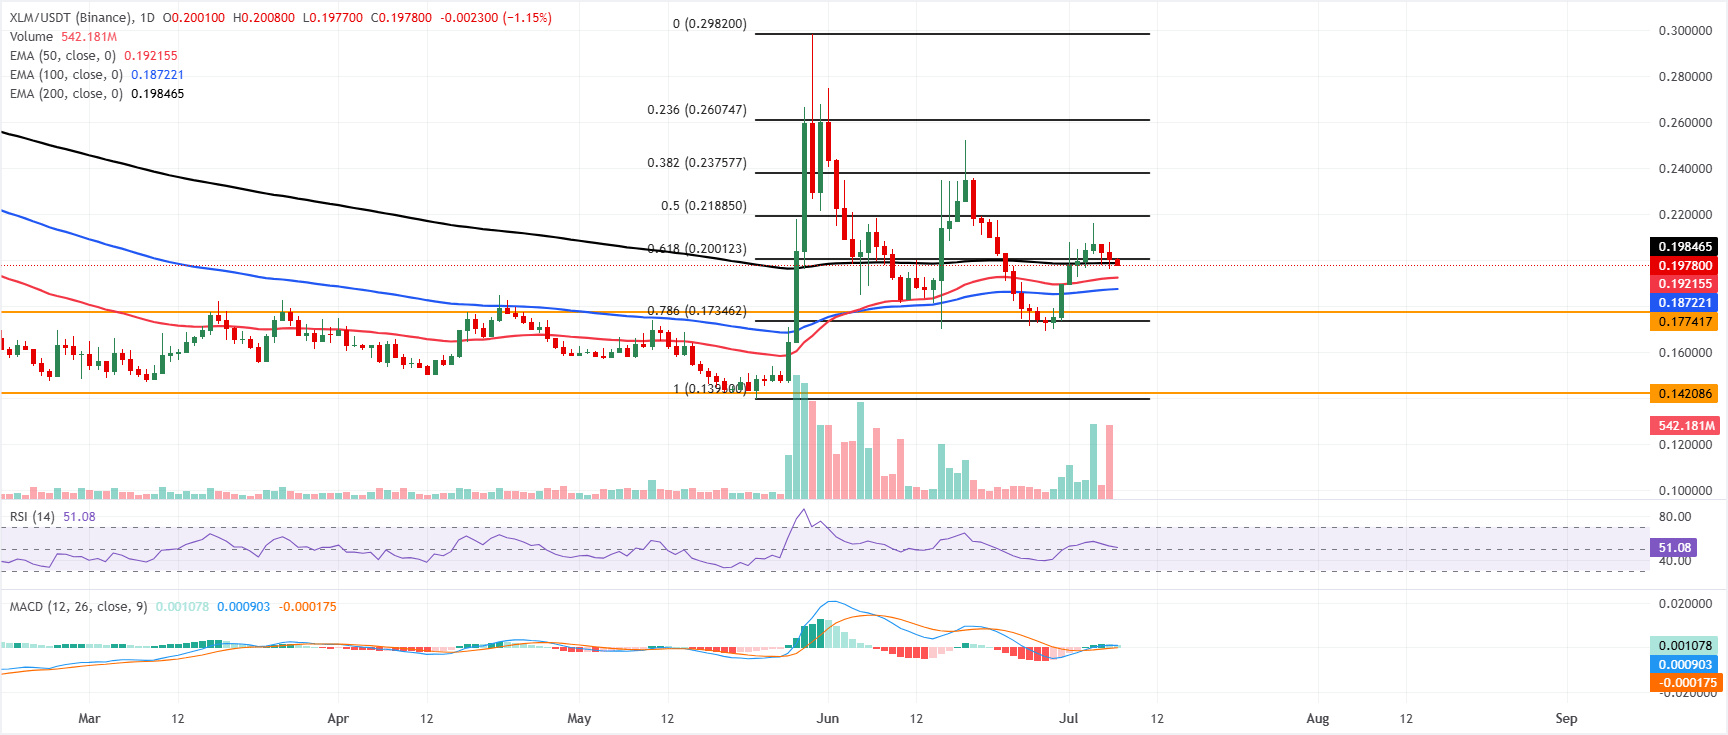
(The technical analysis of this story was written with the help of an AI tool. Know more.)
Ripple FAQs
Ripple is a payments company that specializes in cross-border remittance. The company does this by leveraging blockchain technology. RippleNet is a network used for payments transfer created by Ripple Labs Inc. and is open to financial institutions worldwide. The company also leverages the XRP token.
XRP is the native token of the decentralized blockchain XRPLedger. The token is used by Ripple Labs to facilitate transactions on the XRPLedger, helping financial institutions transfer value in a borderless manner. XRP therefore facilitates trustless and instant payments on the XRPLedger chain, helping financial firms save on the cost of transacting worldwide.
XRPLedger is based on a distributed ledger technology and the blockchain using XRP to power transactions. The ledger is different from other blockchains as it has a built-in inflammatory protocol that helps fight spam and distributed denial-of-service (DDOS) attacks. The XRPL is maintained by a peer-to-peer network known as the global XRP Ledger community.
XRP uses the interledger standard. This is a blockchain protocol that aids payments across different networks. For instance, XRP’s blockchain can connect the ledgers of two or more banks. This effectively removes intermediaries and the need for centralization in the system. XRP acts as the native token of the XRPLedger blockchain engineered by Jed McCaleb, Arthur Britto and David Schwartz.
ARTICOLI POPOLARI
1Gold slides on US yields surge ahead of CPI2Silver Price Forecast: XAG/USD struggles near two-month lows ahead of US CPI3New Zealand Dollar recovers on weaker US Dollar, softer Oil ahead key US CPI4Canadian Dollar recovers as softer US Dollar offers relief ahead of US CPI5Bitcoin targets $84,000 as Strive adds 3,311 BTC to treasury6Dollar Index slips from its 18-month high before US CPI7British Pound finds fresh momentum as BoE hawks set stage for US CPI8Neither a breakout nor a reversal: What OCBC, Commerzbank and ING expect from the US Dollar9Taiwan Dollar: Monetary tightening and housing recovery – DBS
QUOTAZIONI IN DIRETTA

TUTTO SU TECHNICAL
Che cos'è il trading ICT? Spiegazione dei concetti dell'Inner Circle Trader
Supporto e Resistenza: significato, tipologie, come tracciare i livelli e strategie di trading
Che cos'è la liquidità? Significato nel trading e nei mercati finanziari
Liquidity Sweep: Significato, esempi e strategia di trading
Struttura del mercato nel trading: la guida completa (rialzista, ribassista, laterale)
Cambiamento di Carattere (CHoCH): Definizione, Esempi e Strategia
Che cos'è il pattern Bullish Kicker e come fare trading con esso?
Che cos'è un pattern candlestick a martello rovesciato e come si opera?
Che cos'è un pattern Bullish Abandoned Baby e come si negozia?
Inizia ora!
Registrati e accedi ai mercati globali in meno di 3 minuti

Contattaci









Contatti
Telefono: +61 2 8036 8388
Fax: +61 2 8036 8388
Email: support@tmgm.com
Web: https://www.tmgm.com



Le informazioni fornite su questo sito web hanno esclusivamente carattere generale e non costituiscono consulenza finanziaria personalizzata. Prima di agire sulla base di qualsiasi informazione presente su questo sito web, dovresti valutarne l'adeguatezza in relazione ai tuoi obiettivi, alla tua situazione finanziaria e alle tue esigenze. Investire in CFD e contratti FX con margine comporta rischi significativi e non è adatto a tutti gli investitori. Potresti perdere più del tuo deposito iniziale. Non possiedi, né hai, alcun interesse nell'attività sottostante. Ti raccomandiamo di richiedere una consulenza indipendente e di assicurarti di comprendere pienamente i rischi connessi prima di fare trading. È importante leggere e valutare il documento informativo prima di acquisire qualsiasi prodotto elencato sul sito web. Le informazioni e le pubblicità offerte su questo sito web non sono destinate all'uso da parte di persone in paesi o giurisdizioni in cui tale utilizzo sarebbe contrario alle leggi e ai regolamenti locali. I Prodotti e Servizi offerti su questo sito web non sono destinati ai residenti degli Stati Uniti, della Malesia e della Thailandia.
TMGM è autorizzata e regolamentata in diverse giurisdizioni.
Trademax Australia Limited, operante come TMGM, è regolamentata dalla Australian Securities and Investments Commission (ASIC), AFSL n. 436416 e si trova a Level 28, One International Tower, 100 Barangaroo Avenue, 2000 Sydney, NSW Australia.
Email: support@tmgm.com.au
Trademax Global Limited, operante come TMGM, è autorizzata e regolamentata dalla Vanuatu Financial Services Commission (VFSC), numero di registrazione 40356 e registrata a 1276, Kumul Highway, Port Vila, Vanuatu, Repubblica di Vanuatu.
Email: support@tmgm.com
Trademax Global Markets (SE) Limited, operante con il nome TMGM, è autorizzata e regolamentata dalla Financial Services Authority (FSA) delle Seychelles, con numero di licenza SD224. La società è registrata presso l’Ufficio n. 13, Providence Estate ABIS Centre, Mahé, Seychelles.
Email: support@tmgm.com
Trademax Global Markets (International) Pty Ltd, operante come TMGM, è autorizzata e regolamentata dalla Financial Services Commission, Mauritius (FSC) con licenza n. GB22201012, e registrata al 33, Edith Cavell Street C/o IQ EQ Fund Services (Mauritius) Ltd Port Louis, 11324 Mauritius.
Email: support@tmgm.com
Copyright © TMGM. Tutti i diritti riservati