
Shiba Inu Price Forecast: SHIB price eases after breakout as derivatives curb upside
Di Manish Chhetri
Aggiornato: 12 May 2026


ARTICOLI POPOLARI

Shiba Inu (SHIB) edges slightly down, trading at $0.0000065 on Tuesday after breaking out of its consolidation range last week. Derivatives metrics are capping SHIB’s upside move, while the meme coin’s broader technical structure remains supportive of further upside.
- Shiba Inu price trades slightly lower on Tuesday after breaking out of its consolidation range the previous week.
- Derivatives data caps SHIB upside move as funding rates turn negative and short bets are rising among traders.
- Despite cautious sentiment in derivatives market, the broader technical structure continues to support further gains.
Shiba Inu (SHIB) edges slightly down, trading at $0.0000065 on Tuesday after breaking out of its consolidation range last week. Derivatives metrics are capping SHIB’s upside move, while the meme coin’s broader technical structure remains supportive of further upside. Market participants are now awaiting whether SHIB can sustain its breakout momentum or extend its correction.
Derivatives metrics cap SHIB upside move
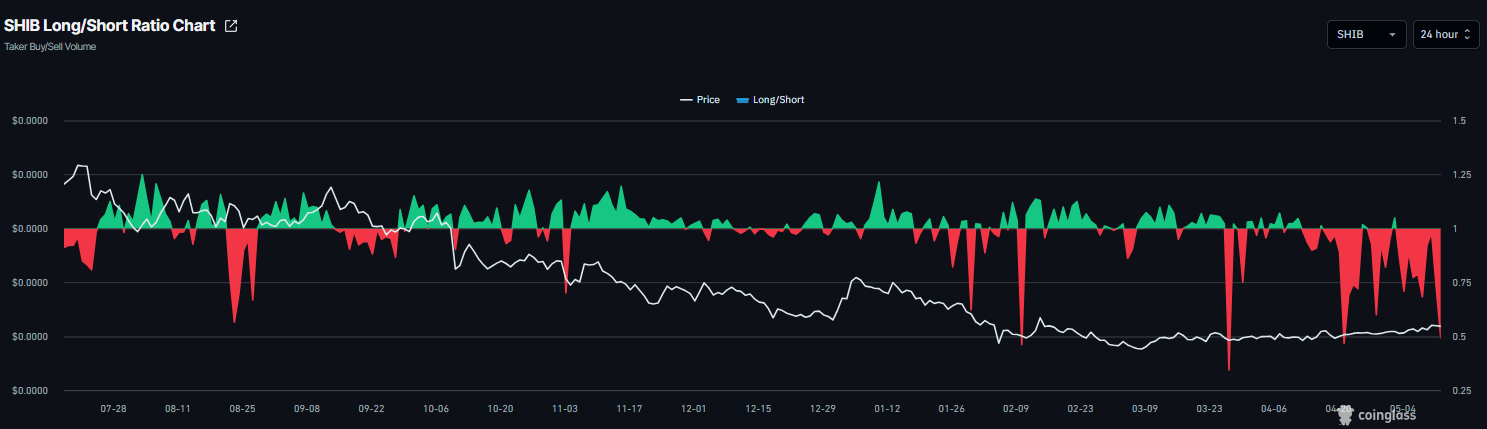
The meme coin’s derivatives metrics show a bearish outlook. CoinGlass’ long-to-short ratio for SHIB read 0.49 on Tuesday, nearing the lowest level over a month. This ratio, being below one, reflects bearish sentiment in the market, as more traders are betting on the asset price to fall.
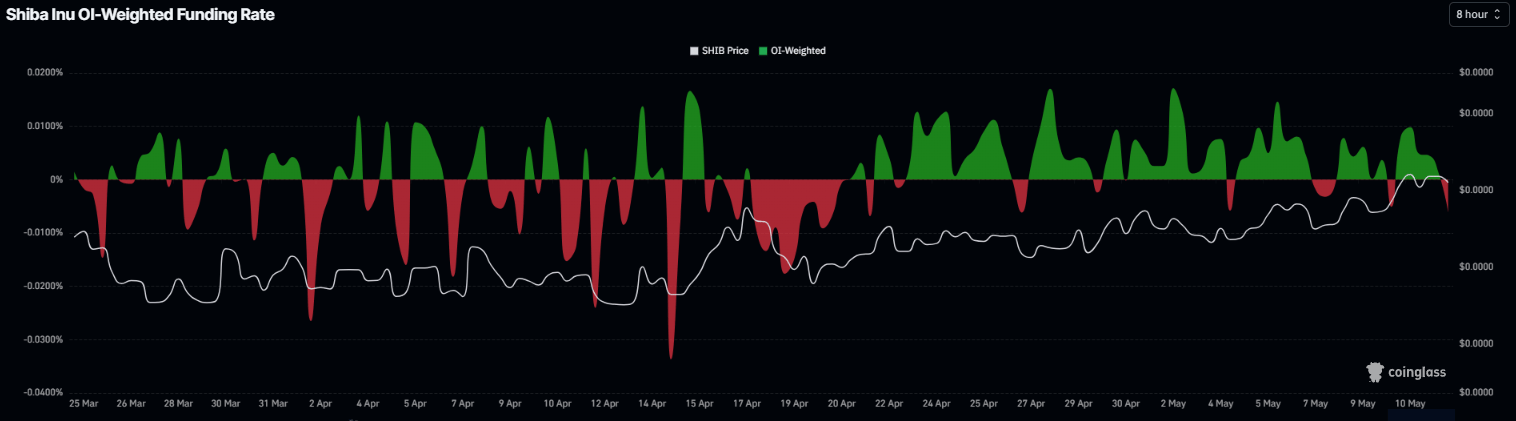
In addition, the funding rates for Shiba Inu have also turned negative. CoinGlass’ OI-Weighted Funding Rate data for SHIB reads -0.0061% on Tuesday, further fueling the bearish outlook and capping SHIB’s upside move.
Shiba Inu Price Forecast: SHIB breaks above the consolidation range
Shiba Inu price found support around the 100-day Exponential Moving Average (EMA) at $0.0000064 on Monday, but trades in red on Tuesday at around $0.0000065. However, the technical outlook remains constructive as SHIB broke above the upper consolidation boundary at $0.0000063 after 58 days of accumulation and rose slightly the previous week.
If SHIB holds above the 100-day EMA at $0.0000064, it could extend the rally toward the weekly resistance at $0.0000068.
The Relative Strength Index (RSI) on the daily chart reads 61, above the neutral level of 50 and below the overbought threshold, indicating bullish momentum. Moreover, the Moving Average Convergence Divergence (MACD) indicator on the same chart shows green histogram bars, supporting the positive outlook.
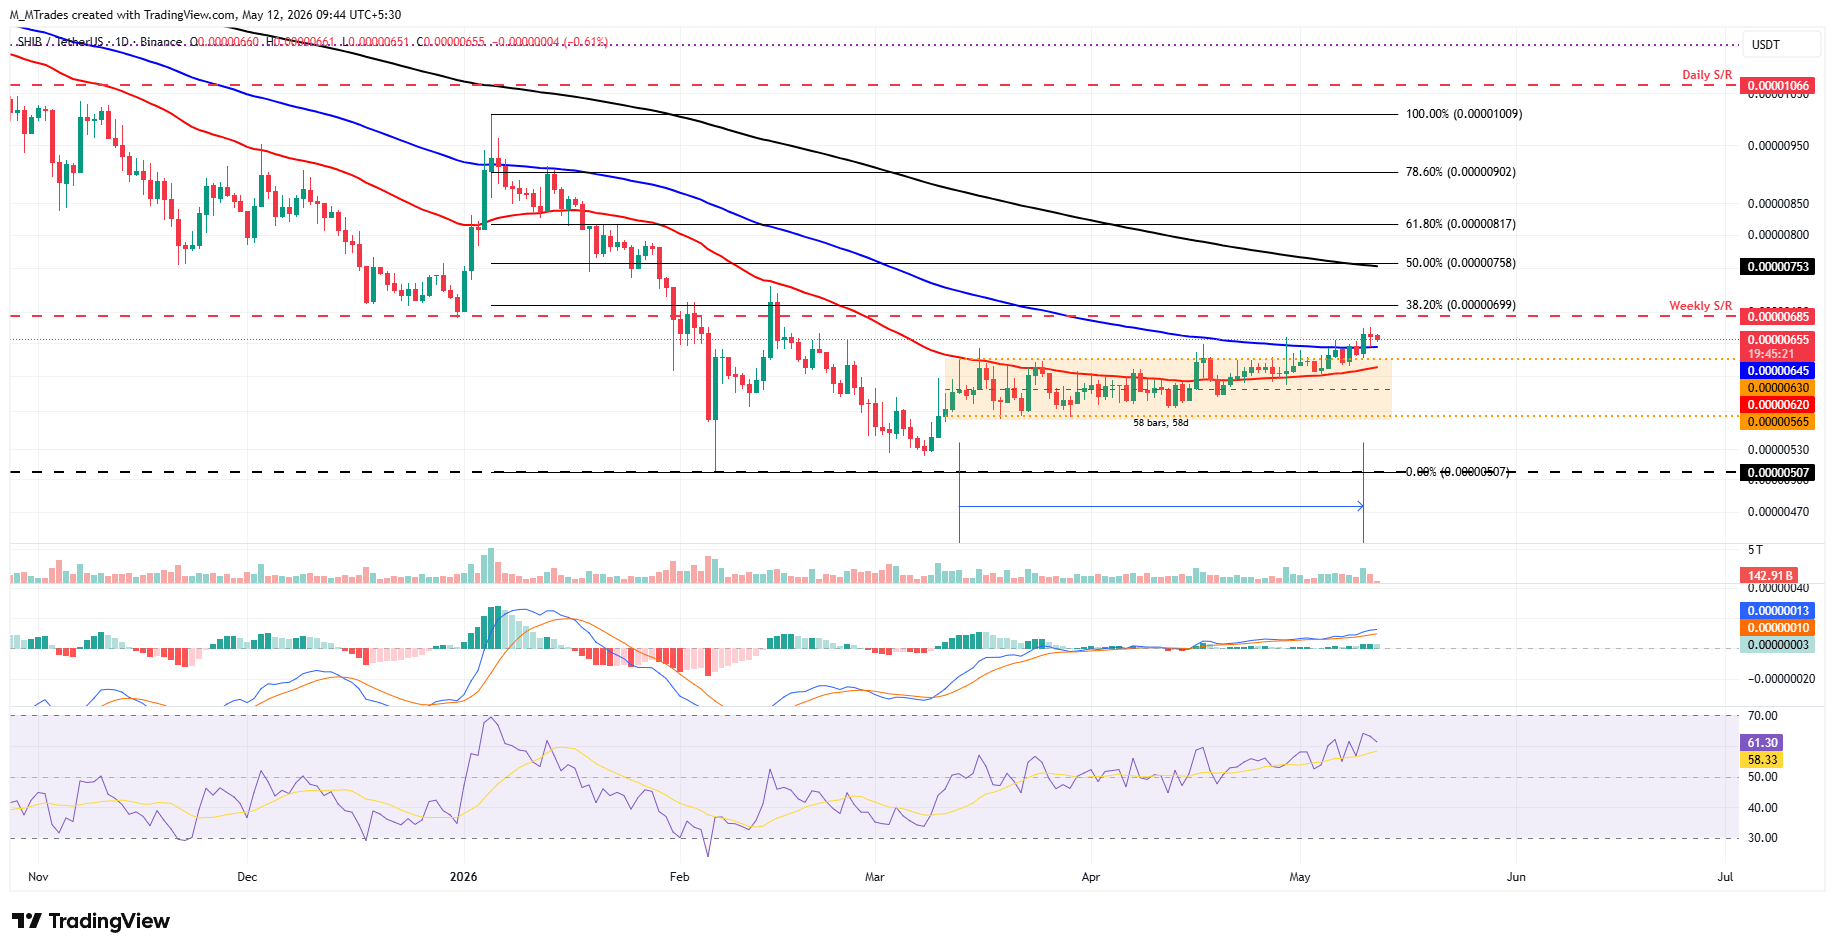
On the other hand, if SHIB faces a correction, it could find support at the upper consolidation boundary at $0.0000063.

Oltre un milione di utenti si affida a FXStreet per dati di mercato in tempo reale, strumenti di charting, approfondimenti di esperti e notizie Forex. Il loro calendario economico completo e i webinar formativi aiutano i trader a rimanere informati e a prendere decisioni ponderate. FXStreet conta circa 60 professionisti tra la sede di Barcellona e diverse regioni globali.
Leggi di più


