
Silver Price Forecast: XAG/USD falls toward $74.00 as bearish bias prevails
Di Akhtar Faruqui
Aggiornato: 4 May 2026


ARTICOLI POPOLARI

Silver may test support near the four-month low of $61.01.
Silver may test support near the four-month low of $61.01.
The 14-day Relative Strength Index at 47.16 suggests weak directional conviction.
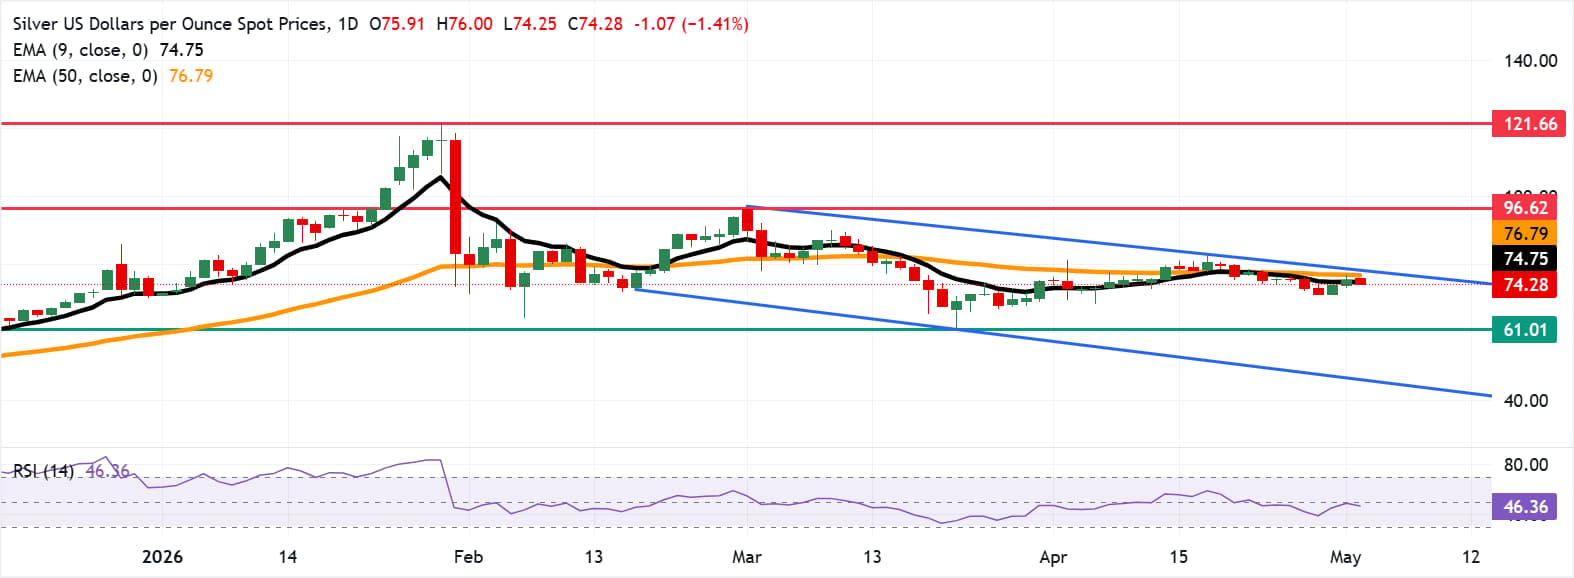
XAG/USD remains near immediate resistance at the nine-day EMA around $74.75.
Silver price (XAG/USD) depreciates after two days of gains, trading around $74.30 per troy ounce during the European hours on Monday. The technical analysis of the daily chart timeframe shows that the metal price is moving within the descending channel pattern, suggesting a persistent bearish bias.
The white metal holds a bearish near-term bias as it remains under both the nine-period and 50-period Exponential Moving Averages (EMAs), keeping the recent rebound capped beneath a declining short- and medium-term trend structure.
The 14-day Relative Strength Index at 47.16 sits just below the neutral band, hinting at a lack of strong directional conviction but failing to offset the negative tone implied by price action below these key averages.
On the downside, the silver price may navigate the region around the four-month low of $61.01, which was recorded on March 23. Further declines would put downward pressure on the metal price to test the lower boundary of the descending channel, around $47.10.
Silver price remains close to the immediate barrier at the nine-day EMA of $74.75, followed by the 50-day EMA at $76.79 and the upper descending channel boundary around $78.90. A sustained break above this confluence resistance zone would cause the emergence of the bullish bias and support the XAG/USD pair to target the three-month high of $96.62, reached on March 2. Further advance would expose the all-time high of 121.66, which was recorded on January 29.
(The technical analysis of this story was written with the help of an AI tool.)
Silver FAQs
Silver is a precious metal highly traded among investors. It has been historically used as a store of value and a medium of exchange. Although less popular than Gold, traders may turn to Silver to diversify their investment portfolio, for its intrinsic value or as a potential hedge during high-inflation periods. Investors can buy physical Silver, in coins or in bars, or trade it through vehicles such as Exchange Traded Funds, which track its price on international markets.
Silver prices can move due to a wide range of factors. Geopolitical instability or fears of a deep recession can make Silver price escalate due to its safe-haven status, although to a lesser extent than Gold's. As a yieldless asset, Silver tends to rise with lower interest rates. Its moves also depend on how the US Dollar (USD) behaves as the asset is priced in dollars (XAG/USD). A strong Dollar tends to keep the price of Silver at bay, whereas a weaker Dollar is likely to propel prices up. Other factors such as investment demand, mining supply – Silver is much more abundant than Gold – and recycling rates can also affect prices.
Silver is widely used in industry, particularly in sectors such as electronics or solar energy, as it has one of the highest electric conductivity of all metals – more than Copper and Gold. A surge in demand can increase prices, while a decline tends to lower them. Dynamics in the US, Chinese and Indian economies can also contribute to price swings: for the US and particularly China, their big industrial sectors use Silver in various processes; in India, consumers’ demand for the precious metal for jewellery also plays a key role in setting prices.
Silver prices tend to follow Gold's moves. When Gold prices rise, Silver typically follows suit, as their status as safe-haven assets is similar. The Gold/Silver ratio, which shows the number of ounces of Silver needed to equal the value of one ounce of Gold, may help to determine the relative valuation between both metals. Some investors may consider a high ratio as an indicator that Silver is undervalued, or Gold is overvalued. On the contrary, a low ratio might suggest that Gold is undervalued relative to Silver.

Oltre un milione di utenti si affida a FXStreet per dati di mercato in tempo reale, strumenti di charting, approfondimenti di esperti e notizie Forex. Il loro calendario economico completo e i webinar formativi aiutano i trader a rimanere informati e a prendere decisioni ponderate. FXStreet conta circa 60 professionisti tra la sede di Barcellona e diverse regioni globali.
Leggi di più


