
Silver Price Forecast: XAG/USD soars to near $70.80 as US-Iran reach peace deal
Di Sagar Dua
Aggiornato: 15 Jun 2026


ARTICOLI POPOLARI
Silver price (XAG/USD) is up 4% to near $70.80 in the Asian trading session on Monday.
- Silver price surges 4% to near $70.80 as the US and Iran reach a peace deal.
- Oil prices nosedive almost 5% on the reopening of the Strait of Hormuz.
- The next trigger for the Silver price will be the Fed’s monetary policy announcement.
Silver price (XAG/USD) is up 4% to near $70.80 in the Asian trading session on Monday. The white metal rallies as the reopening of the Strait of Hormuz, a vital passage to almost 20% of global energy supply, followed by the confirmation of a peace deal between the United States (US) and Iran has pushed oil prices sharply lower.
In the past few months, higher oil prices due to Middle East concerns prompted inflationary pressures globally, and forced traders to price out dovish central bank bets, which diminished the appeal of non-yielding assets, such as Silver.
As of writing, the WTI Oil price is down 4.8% to near $78.85, the lowest level seen in over three months.
On Sunday, US President Donald Trump said in a post on Truth Social, “I hereby fully authorize the toll free opening of the Strait of Hormuz, and, simultaneously herewith, authorize the immediate removal of the United States Naval blockade.”
Meanwhile, Iran’s Deputy Foreign Minister Kazem Gharibabadi has also confirmed that a deal has been reached to end the US-Israeli war with the Islamic Republic, The Times of Israel reported.
Going forward, investors will pay close attention to the Federal Reserve’s (Fed) monetary policy announcement on Wednesday, in which it is expected to leave interest rates unchanged in a range between 3.50%-3.75%.
Silver technical analysis
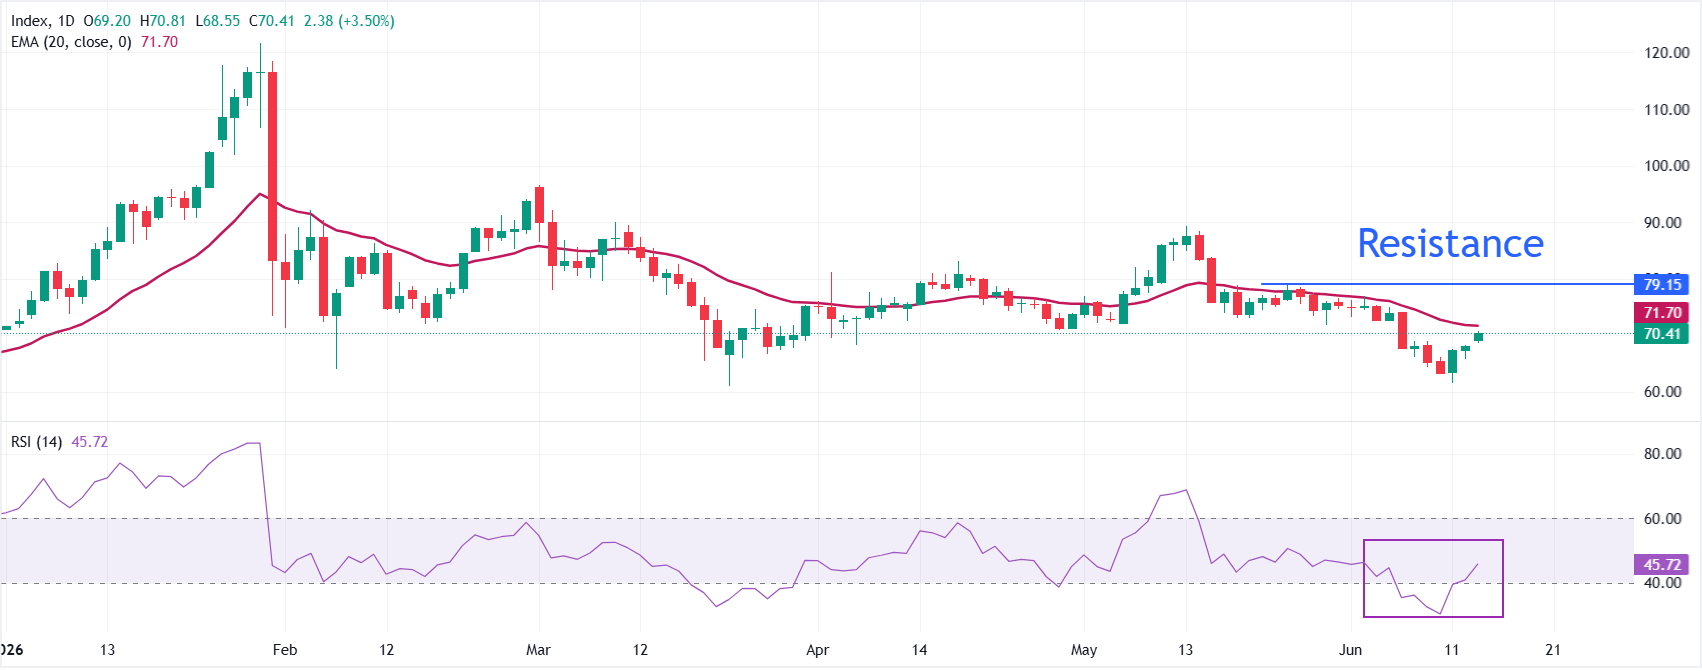
XAG/USD trades significantly higher at around $70.80 at press time. Still, the pair holds a mild bearish near-term bias as price trades below the 20-day Exponential Moving Average (EMA) at $71.70, suggesting rallies remain vulnerable while the broader corrective tone persists.
The Relative Strength Index (RSI) returns to the 40.00-60.00 zone after remaining below 40.00, signaling signs of a bullish reversal. However, it would be more reliable once it breaks above 60.00.
On the topside, a daily close back above the 20-day EMA would be an initial sign of stabilization, opening the door for a more sustained recovery towards the May 25 high at 78.83, followed by the round-level $80.00. On the downside, failure to reclaim the 20-day EMA keeps the focus on lower levels and the retest of the March 23 low at $61.01.
(The technical analysis of this story was written with the help of an AI tool.)
Silver FAQs
Silver is a precious metal highly traded among investors. It has been historically used as a store of value and a medium of exchange. Although less popular than Gold, traders may turn to Silver to diversify their investment portfolio, for its intrinsic value or as a potential hedge during high-inflation periods. Investors can buy physical Silver, in coins or in bars, or trade it through vehicles such as Exchange Traded Funds, which track its price on international markets.
Silver prices can move due to a wide range of factors. Geopolitical instability or fears of a deep recession can make Silver price escalate due to its safe-haven status, although to a lesser extent than Gold's. As a yieldless asset, Silver tends to rise with lower interest rates. Its moves also depend on how the US Dollar (USD) behaves as the asset is priced in dollars (XAG/USD). A strong Dollar tends to keep the price of Silver at bay, whereas a weaker Dollar is likely to propel prices up. Other factors such as investment demand, mining supply – Silver is much more abundant than Gold – and recycling rates can also affect prices.
Silver is widely used in industry, particularly in sectors such as electronics or solar energy, as it has one of the highest electric conductivity of all metals – more than Copper and Gold. A surge in demand can increase prices, while a decline tends to lower them. Dynamics in the US, Chinese and Indian economies can also contribute to price swings: for the US and particularly China, their big industrial sectors use Silver in various processes; in India, consumers’ demand for the precious metal for jewellery also plays a key role in setting prices.
Silver prices tend to follow Gold's moves. When Gold prices rise, Silver typically follows suit, as their status as safe-haven assets is similar. The Gold/Silver ratio, which shows the number of ounces of Silver needed to equal the value of one ounce of Gold, may help to determine the relative valuation between both metals. Some investors may consider a high ratio as an indicator that Silver is undervalued, or Gold is overvalued. On the contrary, a low ratio might suggest that Gold is undervalued relative to Silver.

Oltre un milione di utenti si affida a FXStreet per dati di mercato in tempo reale, strumenti di charting, approfondimenti di esperti e notizie Forex. Il loro calendario economico completo e i webinar formativi aiutano i trader a rimanere informati e a prendere decisioni ponderate. FXStreet conta circa 60 professionisti tra la sede di Barcellona e diverse regioni globali.
Leggi di più


