
USD/CHF Price Forecast: Bullish piercing pattern surfaces, sights on 0.79
Di Christian Borjon Valencia
Aggiornato: 1 Jun 2026


ARTICOLI POPOLARI

The USD/CHF forms a ‘bullish piercing’ chart pattern, which confirms further upside, but it faces key resistance at the 50-day Simple Moving Average (SMA) at 0.7868. At the time of writing, the pair is trading at 0.70% gains, around 0.7860.
- USD/CHF forms bullish piercing pattern, signaling further upside potential.
- RSI turns bullish as buyers reclaim the 100-day SMA.
- Break above 0.7900 exposes 0.8000 and 0.8042 resistance.
The USD/CHF forms a ‘bullish piercing’ chart pattern, which confirms further upside, but it faces key resistance at the 50-day Simple Moving Average (SMA) at 0.7868. At the time of writing, the pair is trading at 0.70% gains, around 0.7860.
USD/CHF Price Forecast: Technical Outlook
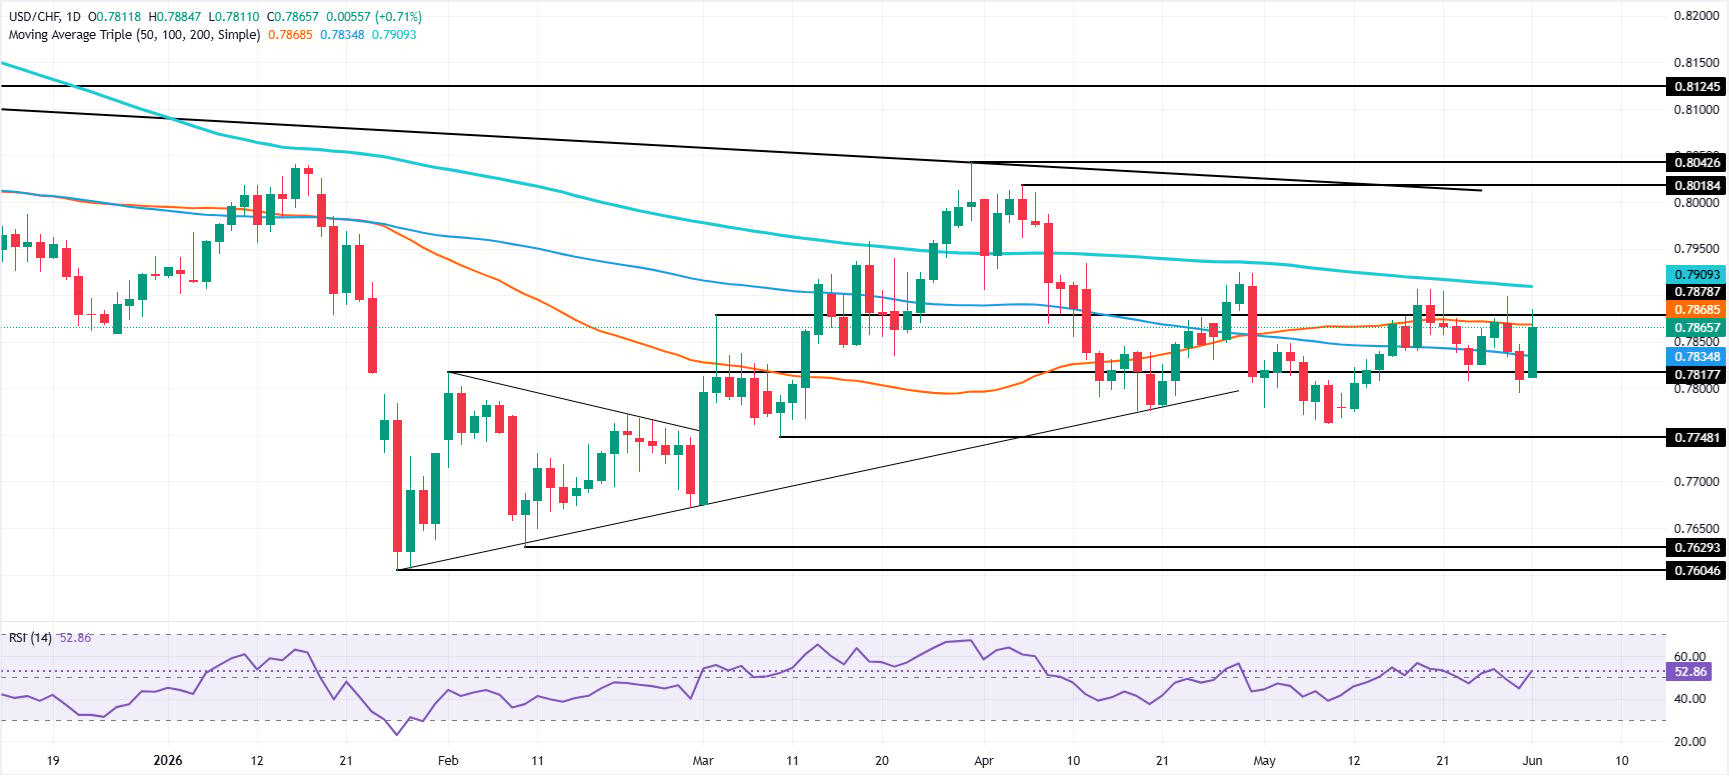
Price action suggests the USD/CHF is consolidating below 0.7900, with buyers gathering momentum, as the pair cleared the 100-day SMA at 0.7834 and the Relative Strength Index (RSI) turned bullish.
On further strength, the USD/CHF can test the 0.7900 mark. Once surpassed, the next stop would be the 0.8000 mark, ahead of the April 6 daily high of 0.8018. A breach of the latter will expose the March 31 swing high at 0.8042, followed by 0.8100.
Downwards, if USD/CHF drops below the 100-day SMA, it would expose the 0.7800 mark. Below this level, the next support would be the May 8 daily low of 0.7761, followed by the March 10 daily low of 0.7748. Underneath the next area of interest would be 0.7700.
USD/CHF Price Chart – Daily
Swiss Franc Price Today
The table below shows the percentage change of Swiss Franc (CHF) against listed major currencies today. Swiss Franc was the strongest against the New Zealand Dollar.
| USD | EUR | GBP | JPY | CAD | AUD | NZD | CHF | |
|---|---|---|---|---|---|---|---|---|
| USD | 0.22% | -0.06% | 0.26% | 0.28% | 0.30% | 0.91% | 0.73% | |
| EUR | -0.22% | -0.26% | 0.00% | 0.06% | 0.14% | 0.70% | 0.49% | |
| GBP | 0.06% | 0.26% | 0.30% | 0.34% | 0.33% | 0.94% | 0.75% | |
| JPY | -0.26% | 0.00% | -0.30% | 0.05% | 0.06% | 0.69% | 0.47% | |
| CAD | -0.28% | -0.06% | -0.34% | -0.05% | 0.01% | 0.62% | 0.43% | |
| AUD | -0.30% | -0.14% | -0.33% | -0.06% | -0.01% | 0.55% | 0.40% | |
| NZD | -0.91% | -0.70% | -0.94% | -0.69% | -0.62% | -0.55% | -0.20% | |
| CHF | -0.73% | -0.49% | -0.75% | -0.47% | -0.43% | -0.40% | 0.20% |
The heat map shows percentage changes of major currencies against each other. The base currency is picked from the left column, while the quote currency is picked from the top row. For example, if you pick the Swiss Franc from the left column and move along the horizontal line to the US Dollar, the percentage change displayed in the box will represent CHF (base)/USD (quote).

Oltre un milione di utenti si affida a FXStreet per dati di mercato in tempo reale, strumenti di charting, approfondimenti di esperti e notizie Forex. Il loro calendario economico completo e i webinar formativi aiutano i trader a rimanere informati e a prendere decisioni ponderate. FXStreet conta circa 60 professionisti tra la sede di Barcellona e diverse regioni globali.
Leggi di più


