
USD/CHF Price Forecast: Retreats as inverted head-and-shoulders remains intact
Di Christian Borjon Valencia
Aggiornato: 15 Jun 2026


ARTICOLI POPOLARI

USD/CHF retreats by over 0.34% on Monday amid most G8 FX currencies appreciating against the US Dollar as the Middle East conflict eases following the US and Iran agreeing to a peace deal. The pair trades at 0.7943, after reaching a high of 0.7968.
- USD/CHF holds inverted head-and-shoulders structure above 200-day SMA support.
- RSI remains above 50, though momentum edges slightly lower.
- Break above 0.8000 exposes 0.8042 and 0.8100 resistance.
USD/CHF retreats by over 0.34% on Monday amid most G8 FX currencies appreciating against the US Dollar as the Middle East conflict eases following the US and Iran agreeing to a peace deal. The pair trades at 0.7943, after reaching a high of 0.7968.
USD/CHF Price Forecast: Technical outlook
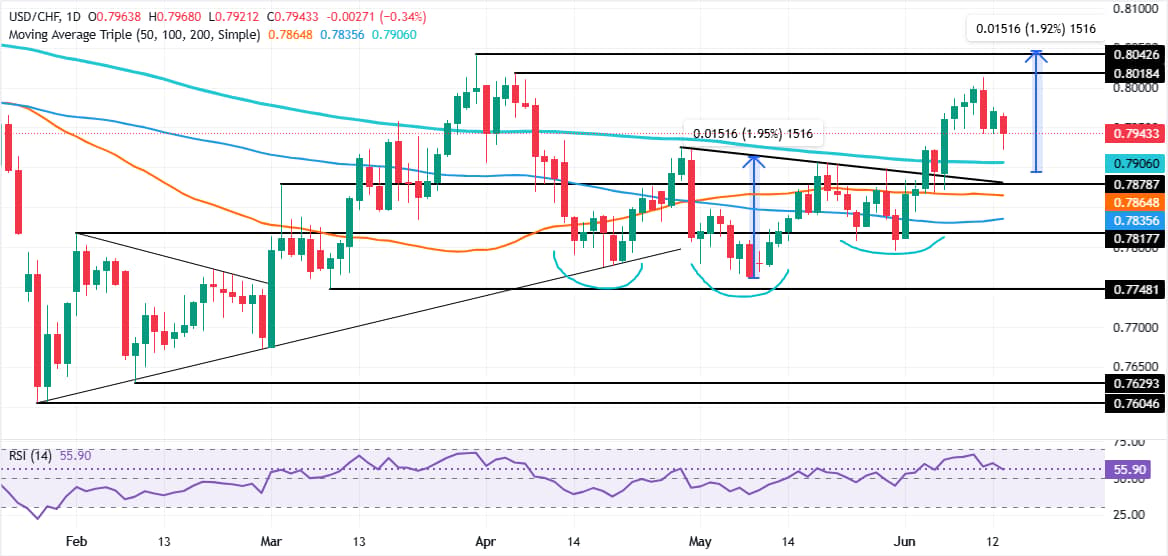
From a technical perspective, the ‘inverted head-and-shoulders’ remains intact, as the USD/CHF approached the 200-day SMA at 0.7906 but buyers lifted the exchange rage, towards the 0.7950. Despite this, bulls are not out of the woods, as momentum edges lower, even though the Relative Strength Index (RSI) favours further upside for USD/CHF, with the index above its 50 neutral level.
The first resistance level for USD/CHF is 0.8000. A breach of the latter will expose the April 6 high at 0.8018, ahead of the March 31 daily high at 0.8042, which is also the inverted ‘head-and-shoulders’ objective. Once those levels are taken out, the 0.8100 is up next.
On the flip side, the USD/CHF first support would be the 200-day SMA at 0.7906. Below is the 0.7900 figure, followed by the 50- and 100-day SMAs, each at 0.7864 and 0.7835.
USD/CHF Price Chart – Daily
Swiss Franc Price Today
The table below shows the percentage change of Swiss Franc (CHF) against listed major currencies today. Swiss Franc was the strongest against the New Zealand Dollar.
| USD | EUR | GBP | JPY | CAD | AUD | NZD | CHF | |
|---|---|---|---|---|---|---|---|---|
| USD | -0.21% | -0.06% | 0.05% | -0.04% | -0.36% | 0.15% | -0.32% | |
| EUR | 0.21% | 0.15% | 0.28% | 0.20% | -0.15% | 0.38% | -0.12% | |
| GBP | 0.06% | -0.15% | 0.13% | 0.04% | -0.32% | 0.24% | -0.28% | |
| JPY | -0.05% | -0.28% | -0.13% | -0.07% | -0.42% | 0.08% | -0.40% | |
| CAD | 0.04% | -0.20% | -0.04% | 0.07% | -0.33% | 0.17% | -0.32% | |
| AUD | 0.36% | 0.15% | 0.32% | 0.42% | 0.33% | 0.53% | 0.06% | |
| NZD | -0.15% | -0.38% | -0.24% | -0.08% | -0.17% | -0.53% | -0.50% | |
| CHF | 0.32% | 0.12% | 0.28% | 0.40% | 0.32% | -0.06% | 0.50% |
The heat map shows percentage changes of major currencies against each other. The base currency is picked from the left column, while the quote currency is picked from the top row. For example, if you pick the Swiss Franc from the left column and move along the horizontal line to the US Dollar, the percentage change displayed in the box will represent CHF (base)/USD (quote).

Oltre un milione di utenti si affida a FXStreet per dati di mercato in tempo reale, strumenti di charting, approfondimenti di esperti e notizie Forex. Il loro calendario economico completo e i webinar formativi aiutano i trader a rimanere informati e a prendere decisioni ponderate. FXStreet conta circa 60 professionisti tra la sede di Barcellona e diverse regioni globali.
Leggi di più


