
XRP and XLM outlook: Bearish streak extends as risk-off mood erodes retail demand, ETF flows
Di Vishal Dixit
Aggiornato: 4 Jun 2026


ARTICOLI POPOLARI

Ripple (XRP) and Stellar (XLM) prices face intense selling pressure, extending losses on Thursday for the fourth consecutive day this week. Cross-border remittance tokens are losing retail sentiment, while XRP faces additional pressure from Exchange-Traded Fund (ETF) outflows.
- XRP extends losses on Thursday, extending losses over 12% so far this week.
- XLM tests its 200-day EMA on Thursday, risking a steeper correction below $0.20.
- Retail strength in XRP and XLM is waning sharply amid a market-wide risk-off sentiment.
Ripple (XRP) and Stellar (XLM) prices face intense selling pressure, extending losses on Thursday for the fourth consecutive day this week. Cross-border remittance tokens are losing retail sentiment, while XRP faces additional pressure from Exchange-Traded Fund (ETF) outflows.
Retail demand corrects amid price drop
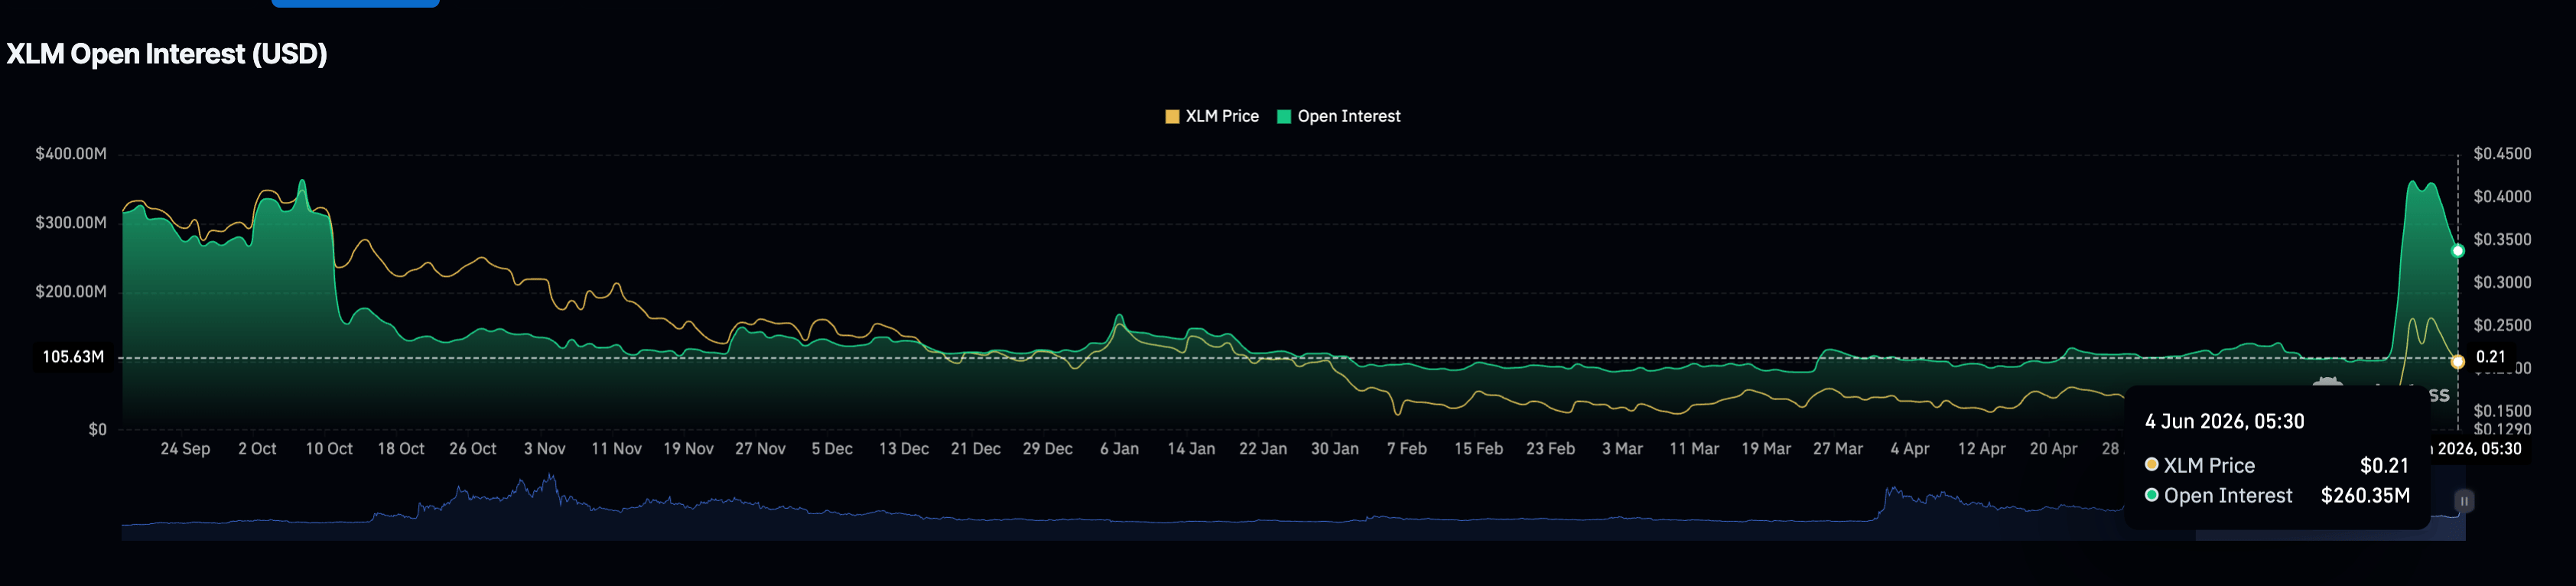
Stellar experiences a sharp correction in its newfound retail demand built on the Depository Trust & Clearing Corporation (DTCC) partnership to tokenize assets. CoinGlass data shows the XLM futures Open Interest (OI) to $260.35 million on Thursday, maintaining a steady decline from the $358.78 million peak on Monday. This suggests a sharp reduction in positional buildup that had formed in anticipation of further upside in XLM.
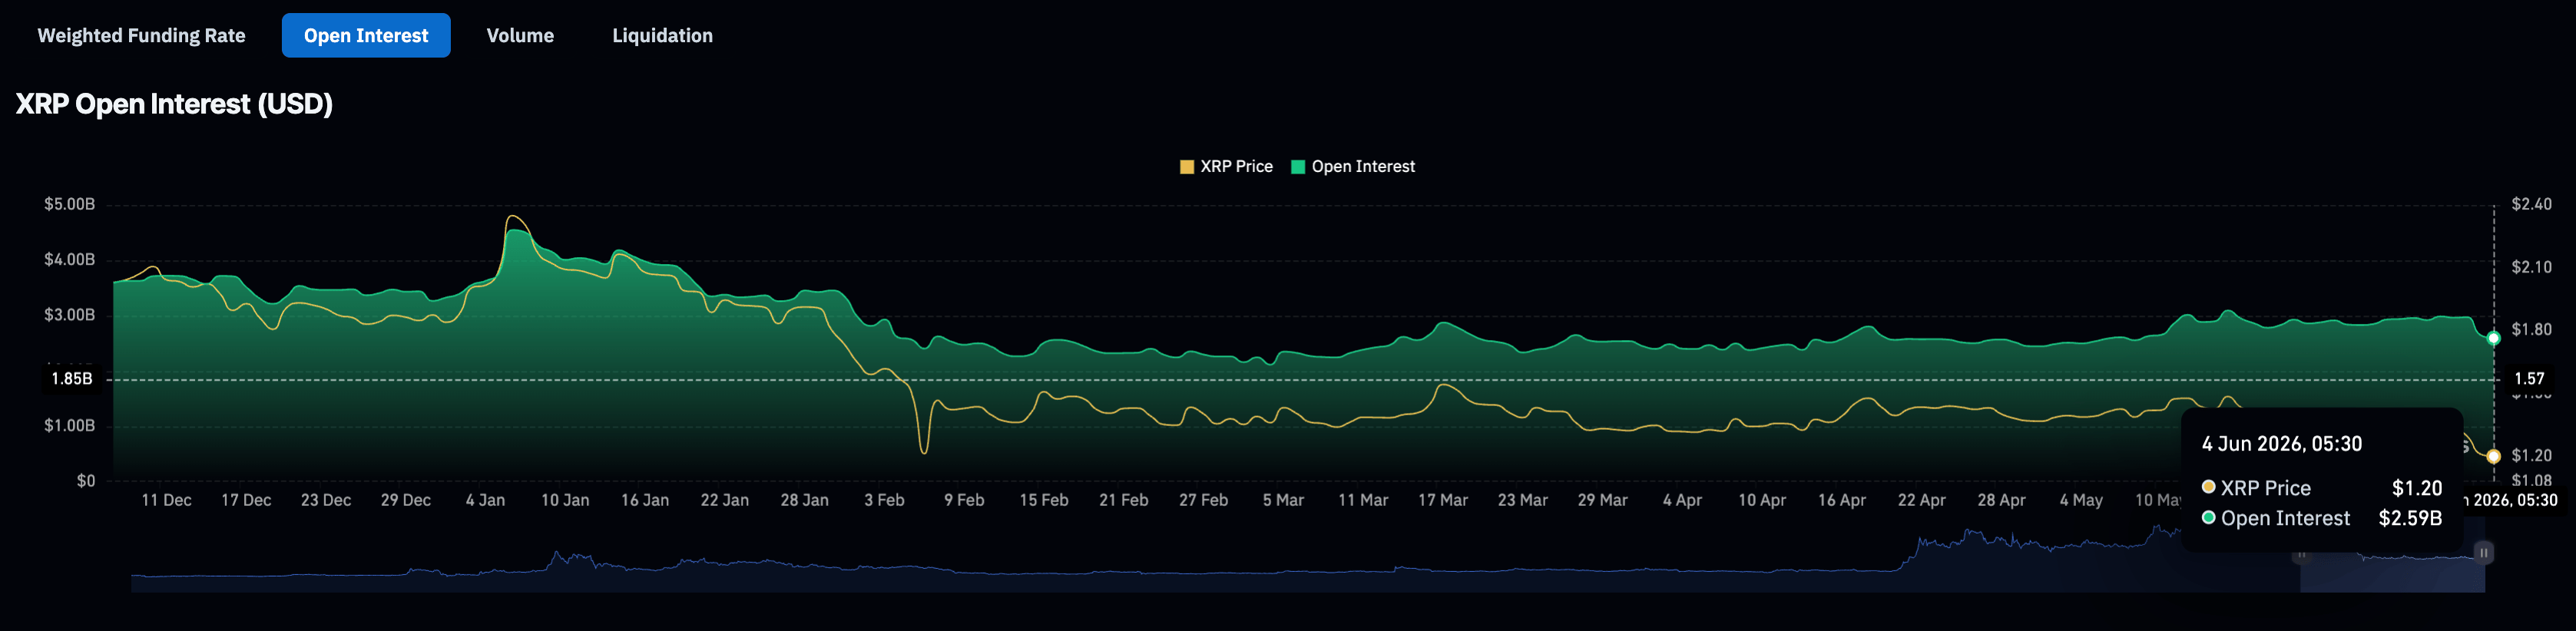
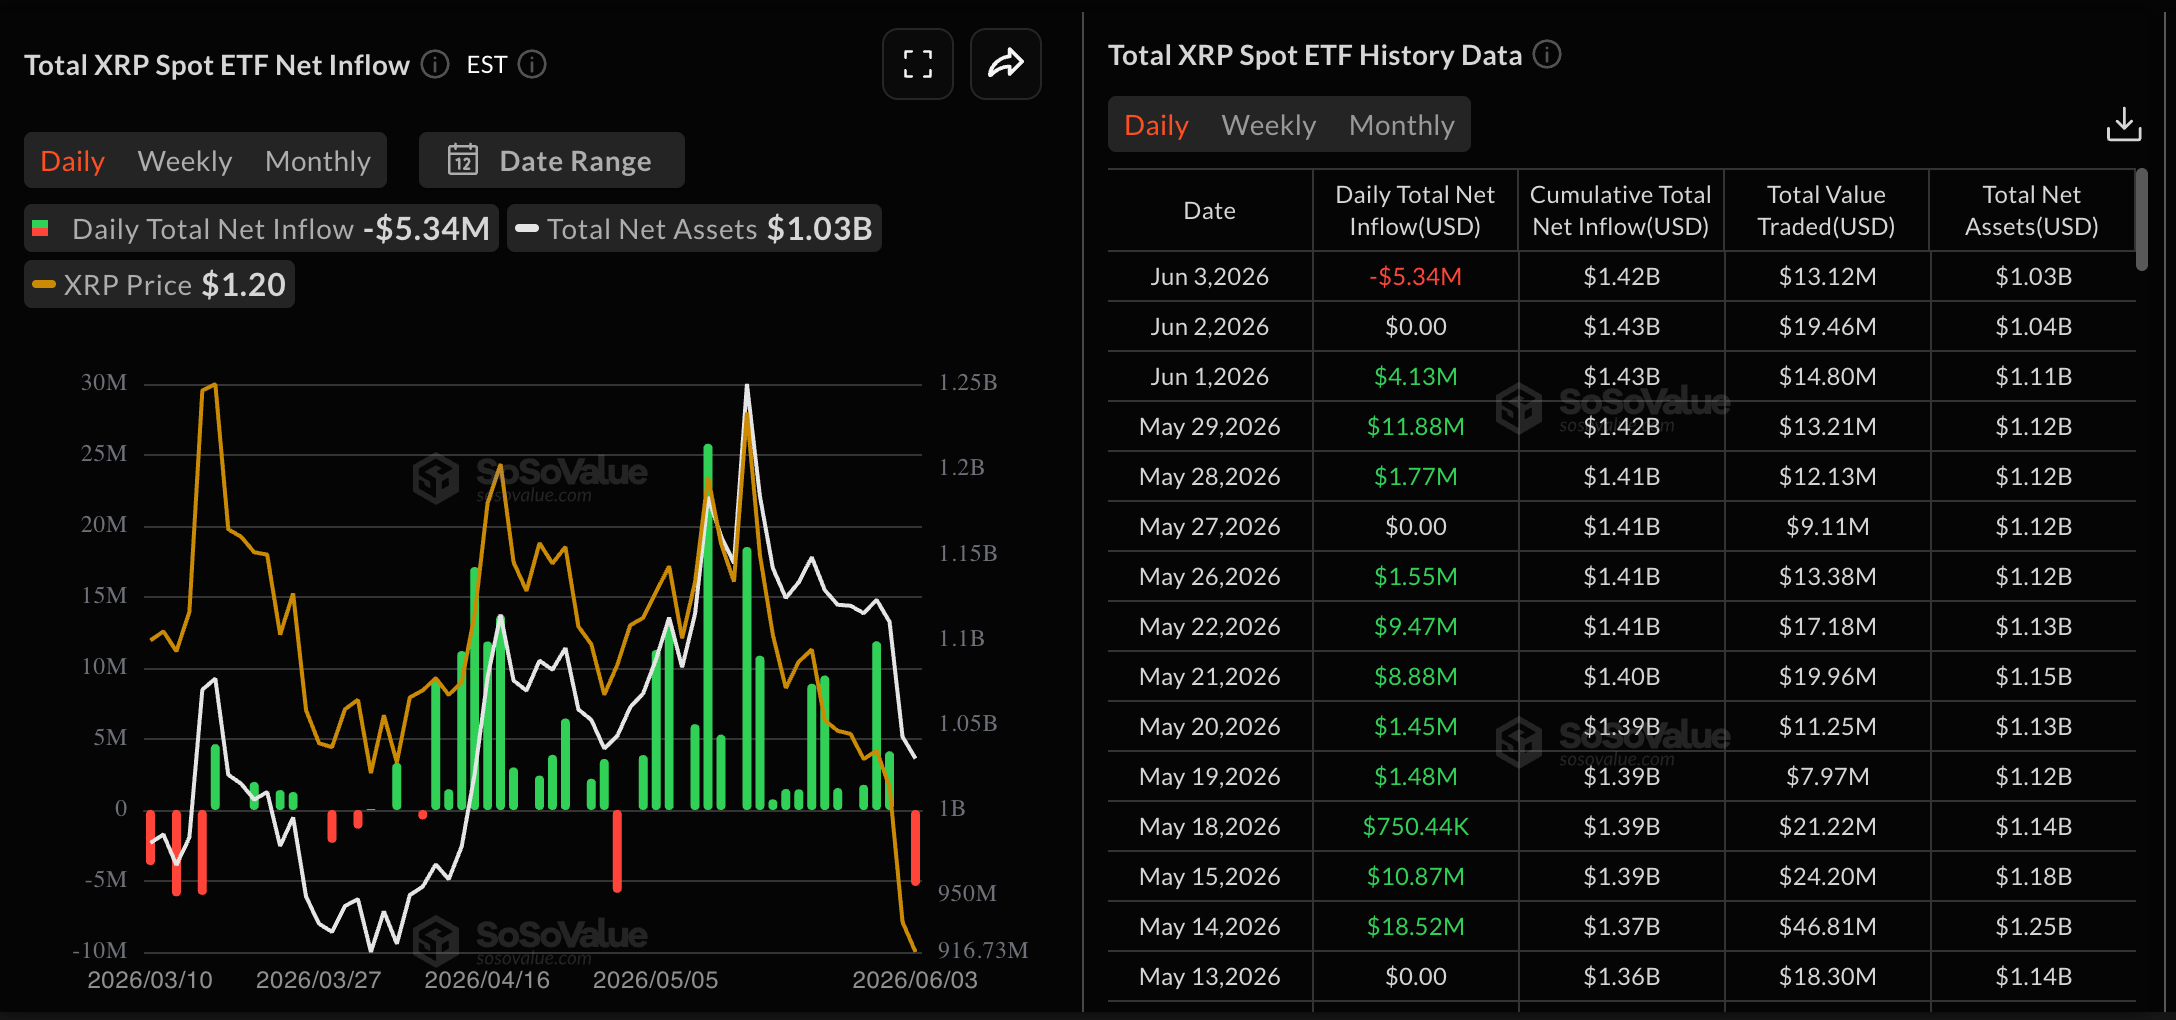
Similarly, the XRP OI dives to a $2.59 billion on Thursday, from the $2.97 billion peak on Tuesday. That said, XRP faces additional institutional pressure with $5.34 million in ETF outflows on Wednesday, breaking the streak of no outflows since April 30.
XRP extends its free fall
XRP is down roughly 4% at press time on Thursday, holding above $1.1500 amid a growingly bearish tone. The price remains well below the key Exponential Moving Averages (EMAs), including the 50-day EMA at $1.3610, the 100-day EMA at $1.4367, and the 200-day EMA at $1.6337, which together form a layered topside cap reinforcing a downside bias.
Momentum conditions are weak on the daily chart, with the Relative Strength Index (RSI) slipping into oversold territory near 24 and the Moving Average Convergence Divergence (MACD) line deep in negative territory, together hinting at persistent selling pressure despite intermittent corrective bounces.
Looking down, the February 6 low at $1.1179 remains the sole support in sight, guarding the downside to the $1.00 psychological threshold.
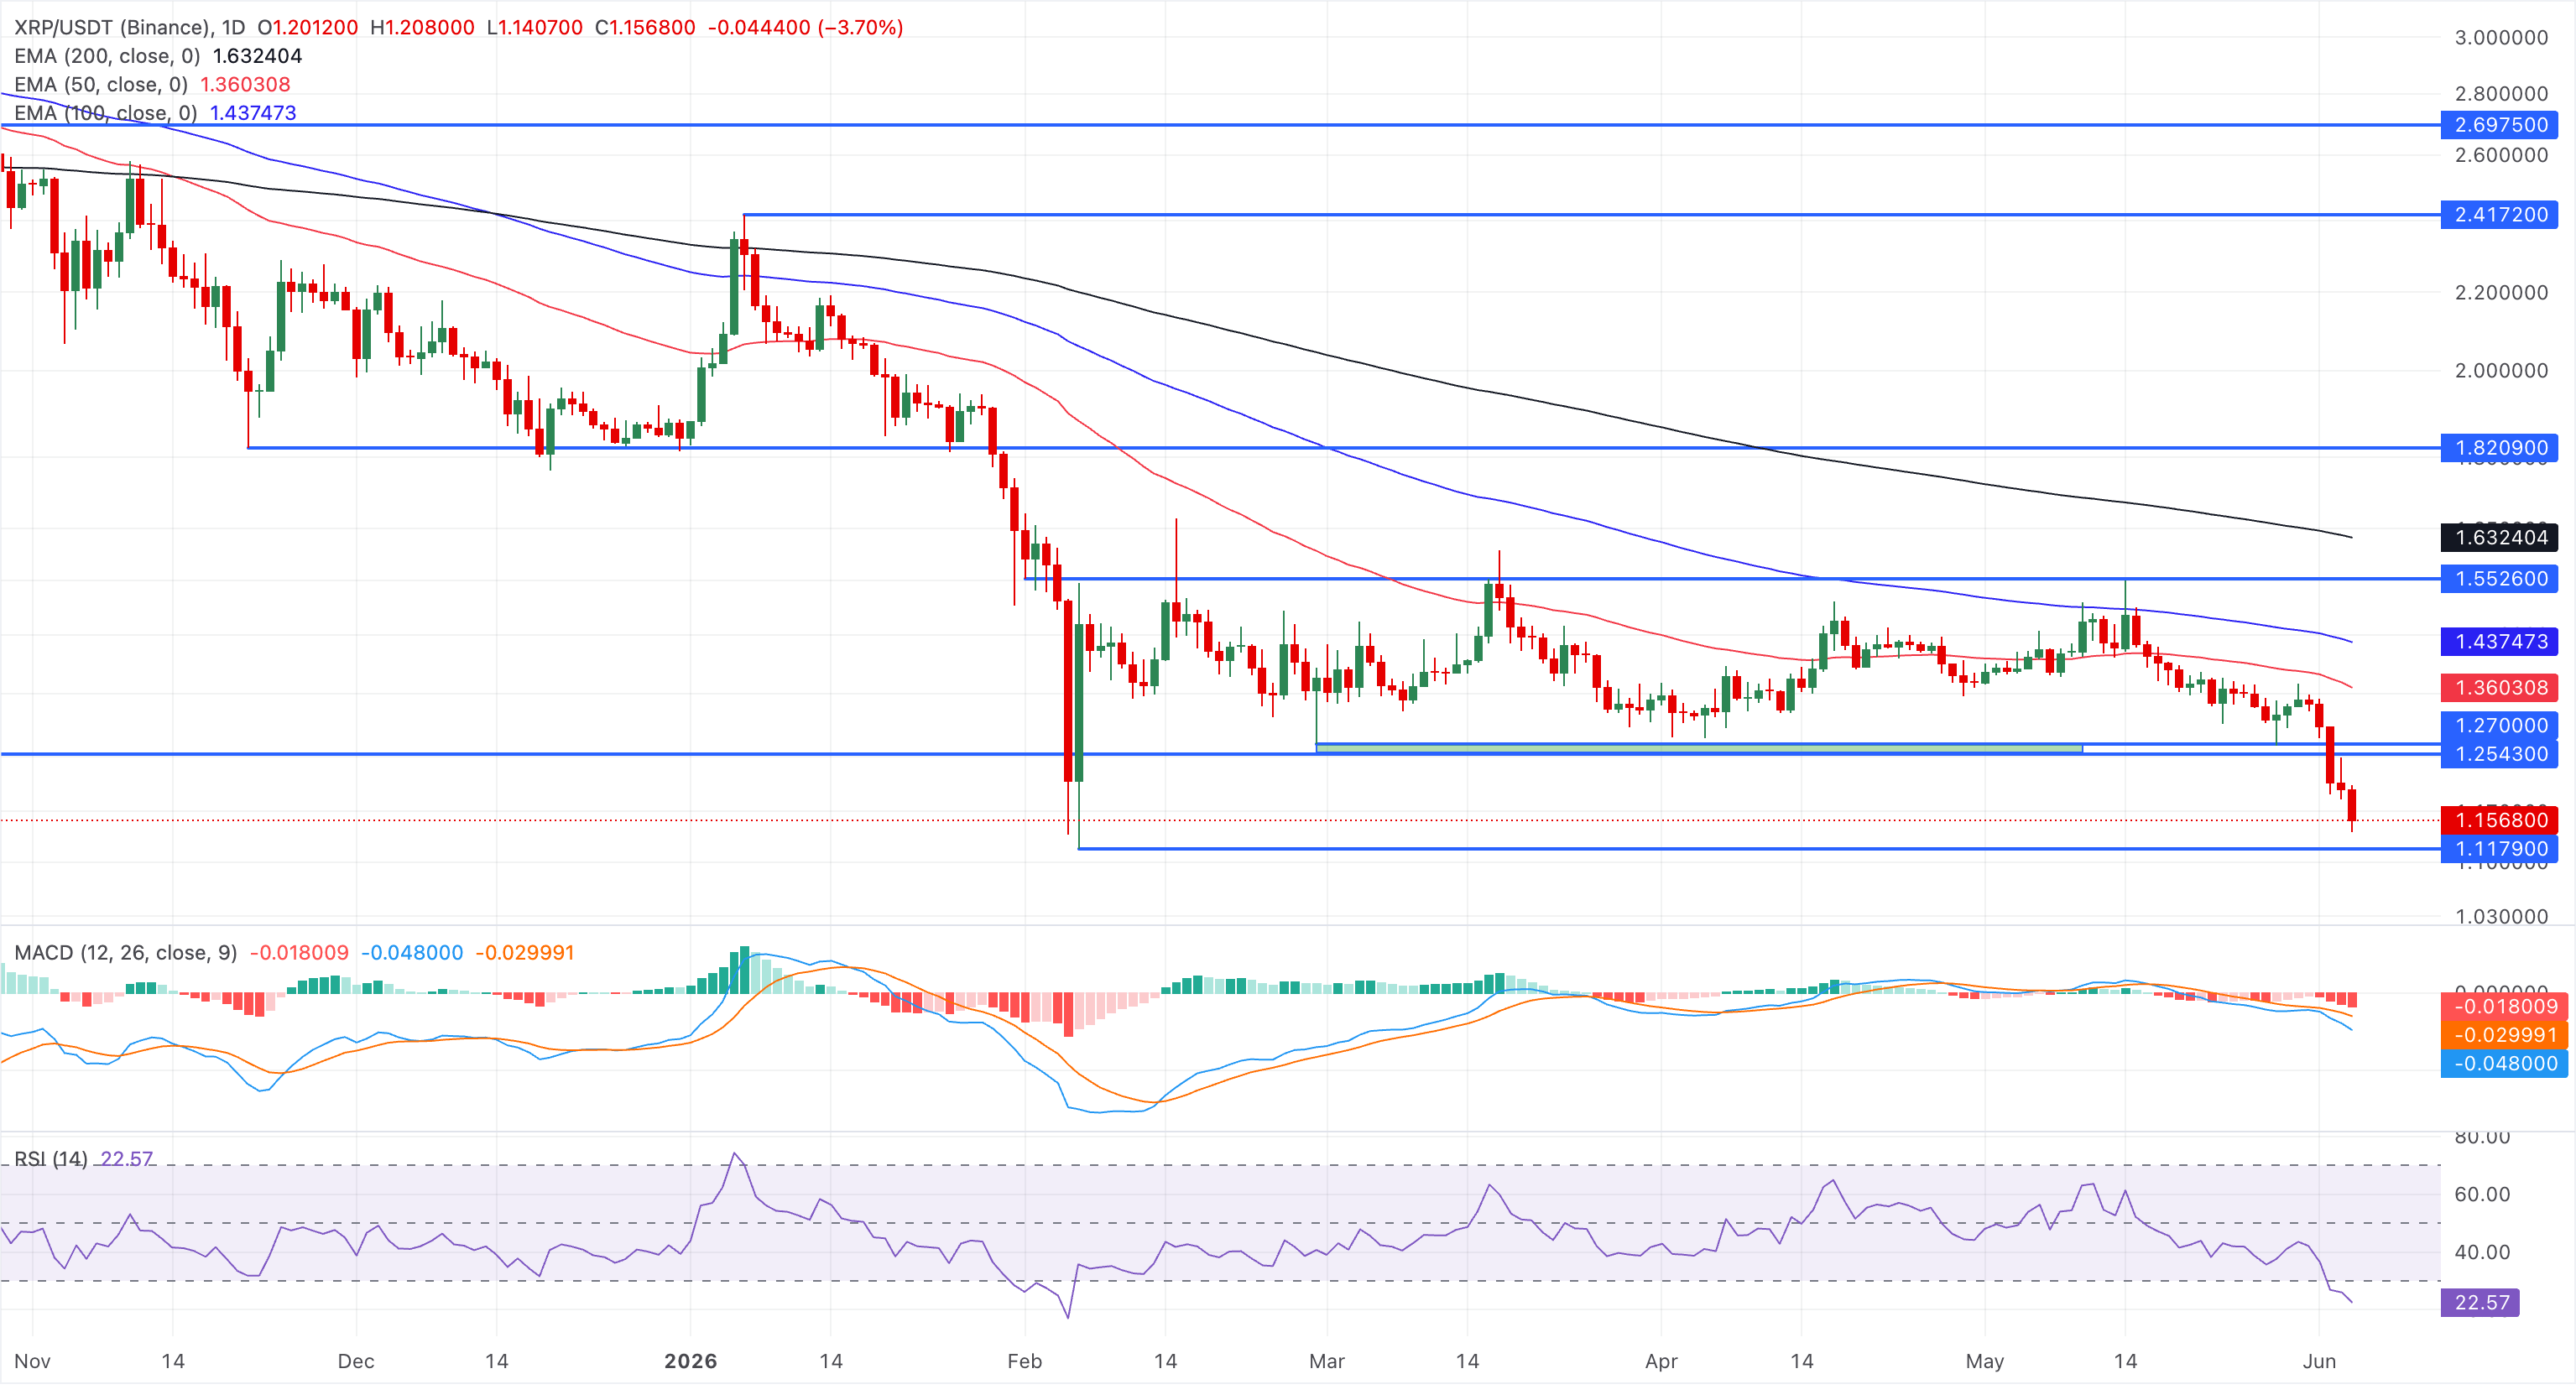
Initial resistance is at the 50-day EMA near 1.36, with further barriers at the 100-day EMA near 1.44 and the 200-day EMA near 1.63, where any recovery is likely to face renewed supply.
Stellar takes a sharp bearish turn
Stellar trades above $0.2033, holding a constructive near-term bias as it sits above the 200-day EMA at roughly $0.1975. The shorter-term 50- and 100-day EMAs, clustered just above $0.1770, remain well below spot, underscoring an improving trend.
That said, the RSI near 55 on the daily chart has plunged from the overbought zone to near the midline, while the MACD approaches its signal line for a crossover as the bullish profile contracts, signaling waning upside momentum.
On the downside, initial support is seen at the 200-day EMA around $0.1975, where a break would expose a deeper corrective phase back toward prior consolidation levels.
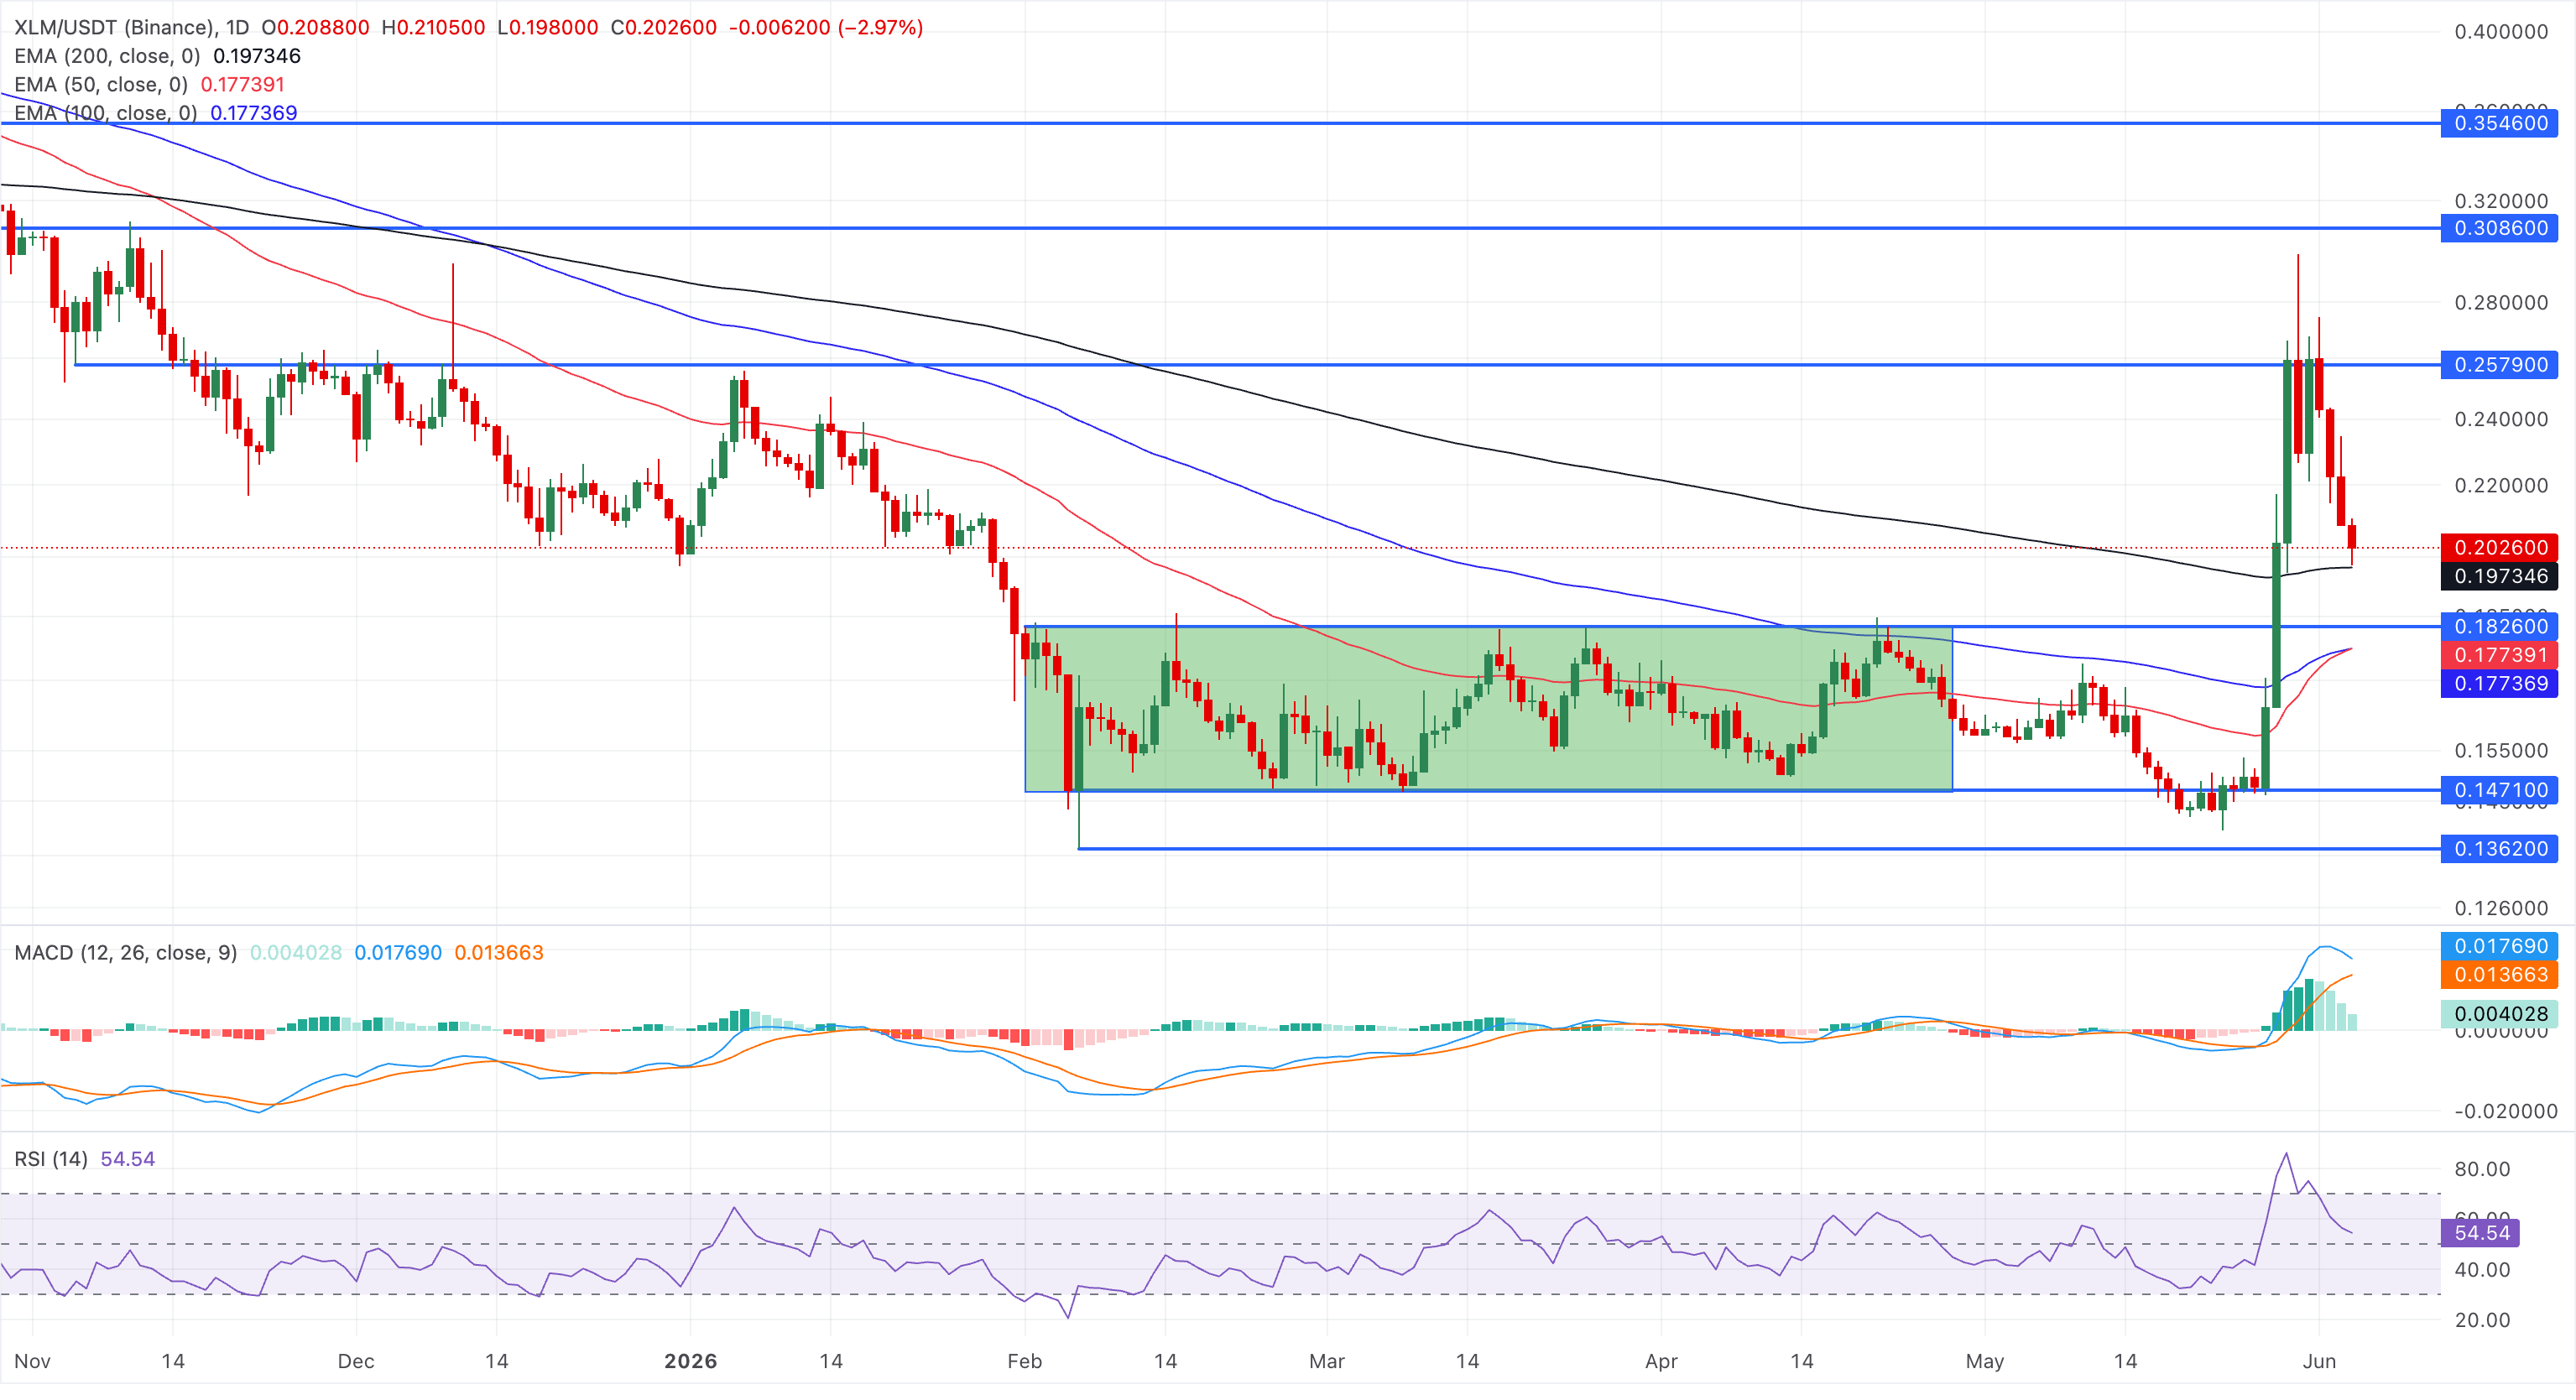
On the topside, a potential rebound from the 200-day EMA could retest the $0.2579 resistance level, which capped the recovery in late May.
(The technical analysis of this story was written with the help of an AI tool.)
Cryptocurrency metrics FAQs
The developer or creator of each cryptocurrency decides on the total number of tokens that can be minted or issued. Only a certain number of these assets can be minted by mining, staking or other mechanisms. This is defined by the algorithm of the underlying blockchain technology. On the other hand, circulating supply can also be decreased via actions such as burning tokens, or mistakenly sending assets to addresses of other incompatible blockchains.
Market capitalization is the result of multiplying the circulating supply of a certain asset by the asset’s current market value.
Trading volume refers to the total number of tokens for a specific asset that has been transacted or exchanged between buyers and sellers within set trading hours, for example, 24 hours. It is used to gauge market sentiment, this metric combines all volumes on centralized exchanges and decentralized exchanges. Increasing trading volume often denotes the demand for a certain asset as more people are buying and selling the cryptocurrency.
Funding rates are a concept designed to encourage traders to take positions and ensure perpetual contract prices match spot markets. It defines a mechanism by exchanges to ensure that future prices and index prices periodic payments regularly converge. When the funding rate is positive, the price of the perpetual contract is higher than the mark price. This means traders who are bullish and have opened long positions pay traders who are in short positions. On the other hand, a negative funding rate means perpetual prices are below the mark price, and hence traders with short positions pay traders who have opened long positions.

Oltre un milione di utenti si affida a FXStreet per dati di mercato in tempo reale, strumenti di charting, approfondimenti di esperti e notizie Forex. Il loro calendario economico completo e i webinar formativi aiutano i trader a rimanere informati e a prendere decisioni ponderate. FXStreet conta circa 60 professionisti tra la sede di Barcellona e diverse regioni globali.
Leggi di più


