

Zcash Price Forecast: ZEC hits a make-or-break level as retail demand loses conviction
- Zcash holds above $450 on Tuesday, testing its 50-day EMA at $453.
- A 3% drop in ZEC futures Open Interest over 24 hours suggests the risk-on sentiment among traders is easing.
- The technical outlook for ZEC is mixed, with risks of a steeper decline toward its 200-day EMA at $382.
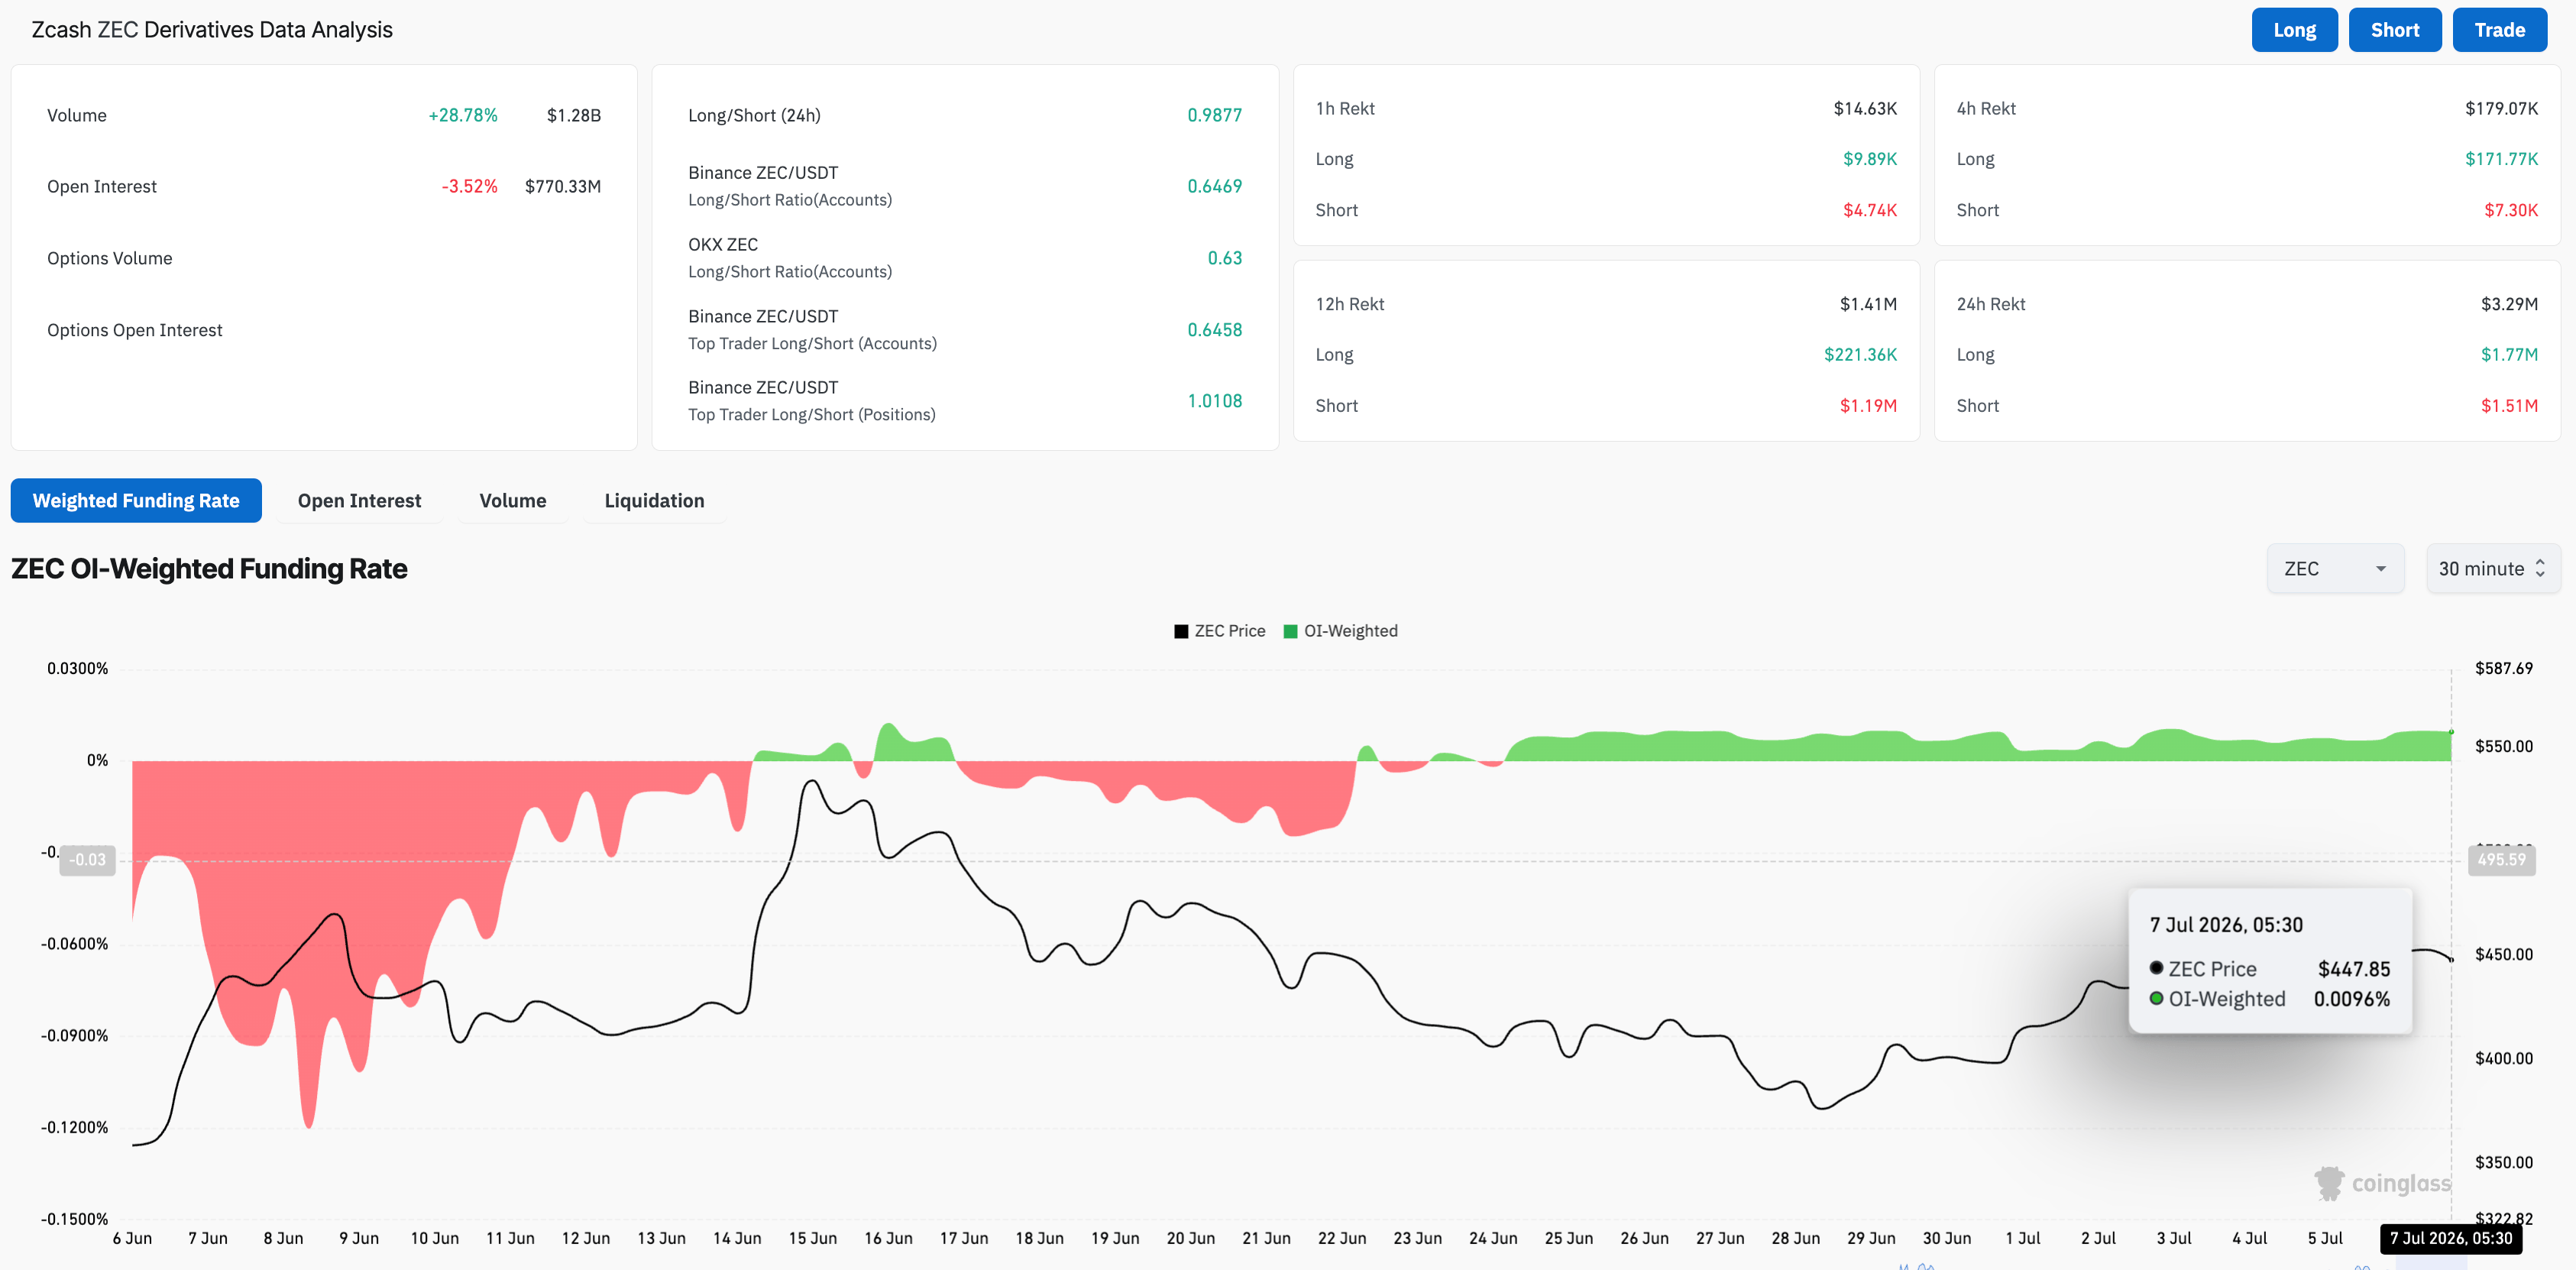
Zcash (ZEC) eases below $450 at press time on Tuesday, extending its mild loss from the previous day. The privacy coin is losing retail support, with ZEC futures Open Interest declining by 3% over the past 24 hours while funding rates hold steady.

Technically, Zcash is at a make-or-break level, with risks of a steeper correction toward its 200-day Exponential Moving Average (EMA) at $382, or a potential breakout rally toward $500.
Zcash derivatives project mixed retail demand
Zcash is losing its retail demand, which surged last week as the broader cryptocurrency market recovered. CoinGlass data show that ZEC futures Open Interest (OI) is down over 3% in the last 24 hours to $770.33 million, indicating a reduction in leveraged positions as traders' risk appetite declines. The liquidation data show $1.77 million in long liquidations slightly outpace $1.51 million in short liquidations, indicating indecisiveness in the near term.
However, the funding rate remains broadly stable at 0.0096%, indicating that traders are still willing to buy long positions at a premium. The residual bullish sentiment despite declining OI suggests traders are slowly losing upside conviction.
Will Zcash hold above $450 for a breakout rally?
Zcash hovers above $450 at press time on Tuesday, testing its 50-day EMA at $453, while price remains capped below the local resistance trendline at $465. The privacy coin is well placed above its 200-day EMA at $382, projecting a longer-term uptrend. This mixed location keeps the near-term bias neutral to slightly capped.
From a technical perspective, a decisive close above $465 would confirm the trendline breakout, with potential targets including the $500 mark and the 78.6% Fibonacci retracement level at $520, measured from the $184 to $690 upswing.
The Moving Average Convergence Divergence (MACD) and signal line track sideways as the positive histograms contract, hinting at an easing bullish momentum. Meanwhile, the Relative Strength Index (RSI) near 50 reaffirms a neutral equilibrium rather than a strong directional push.
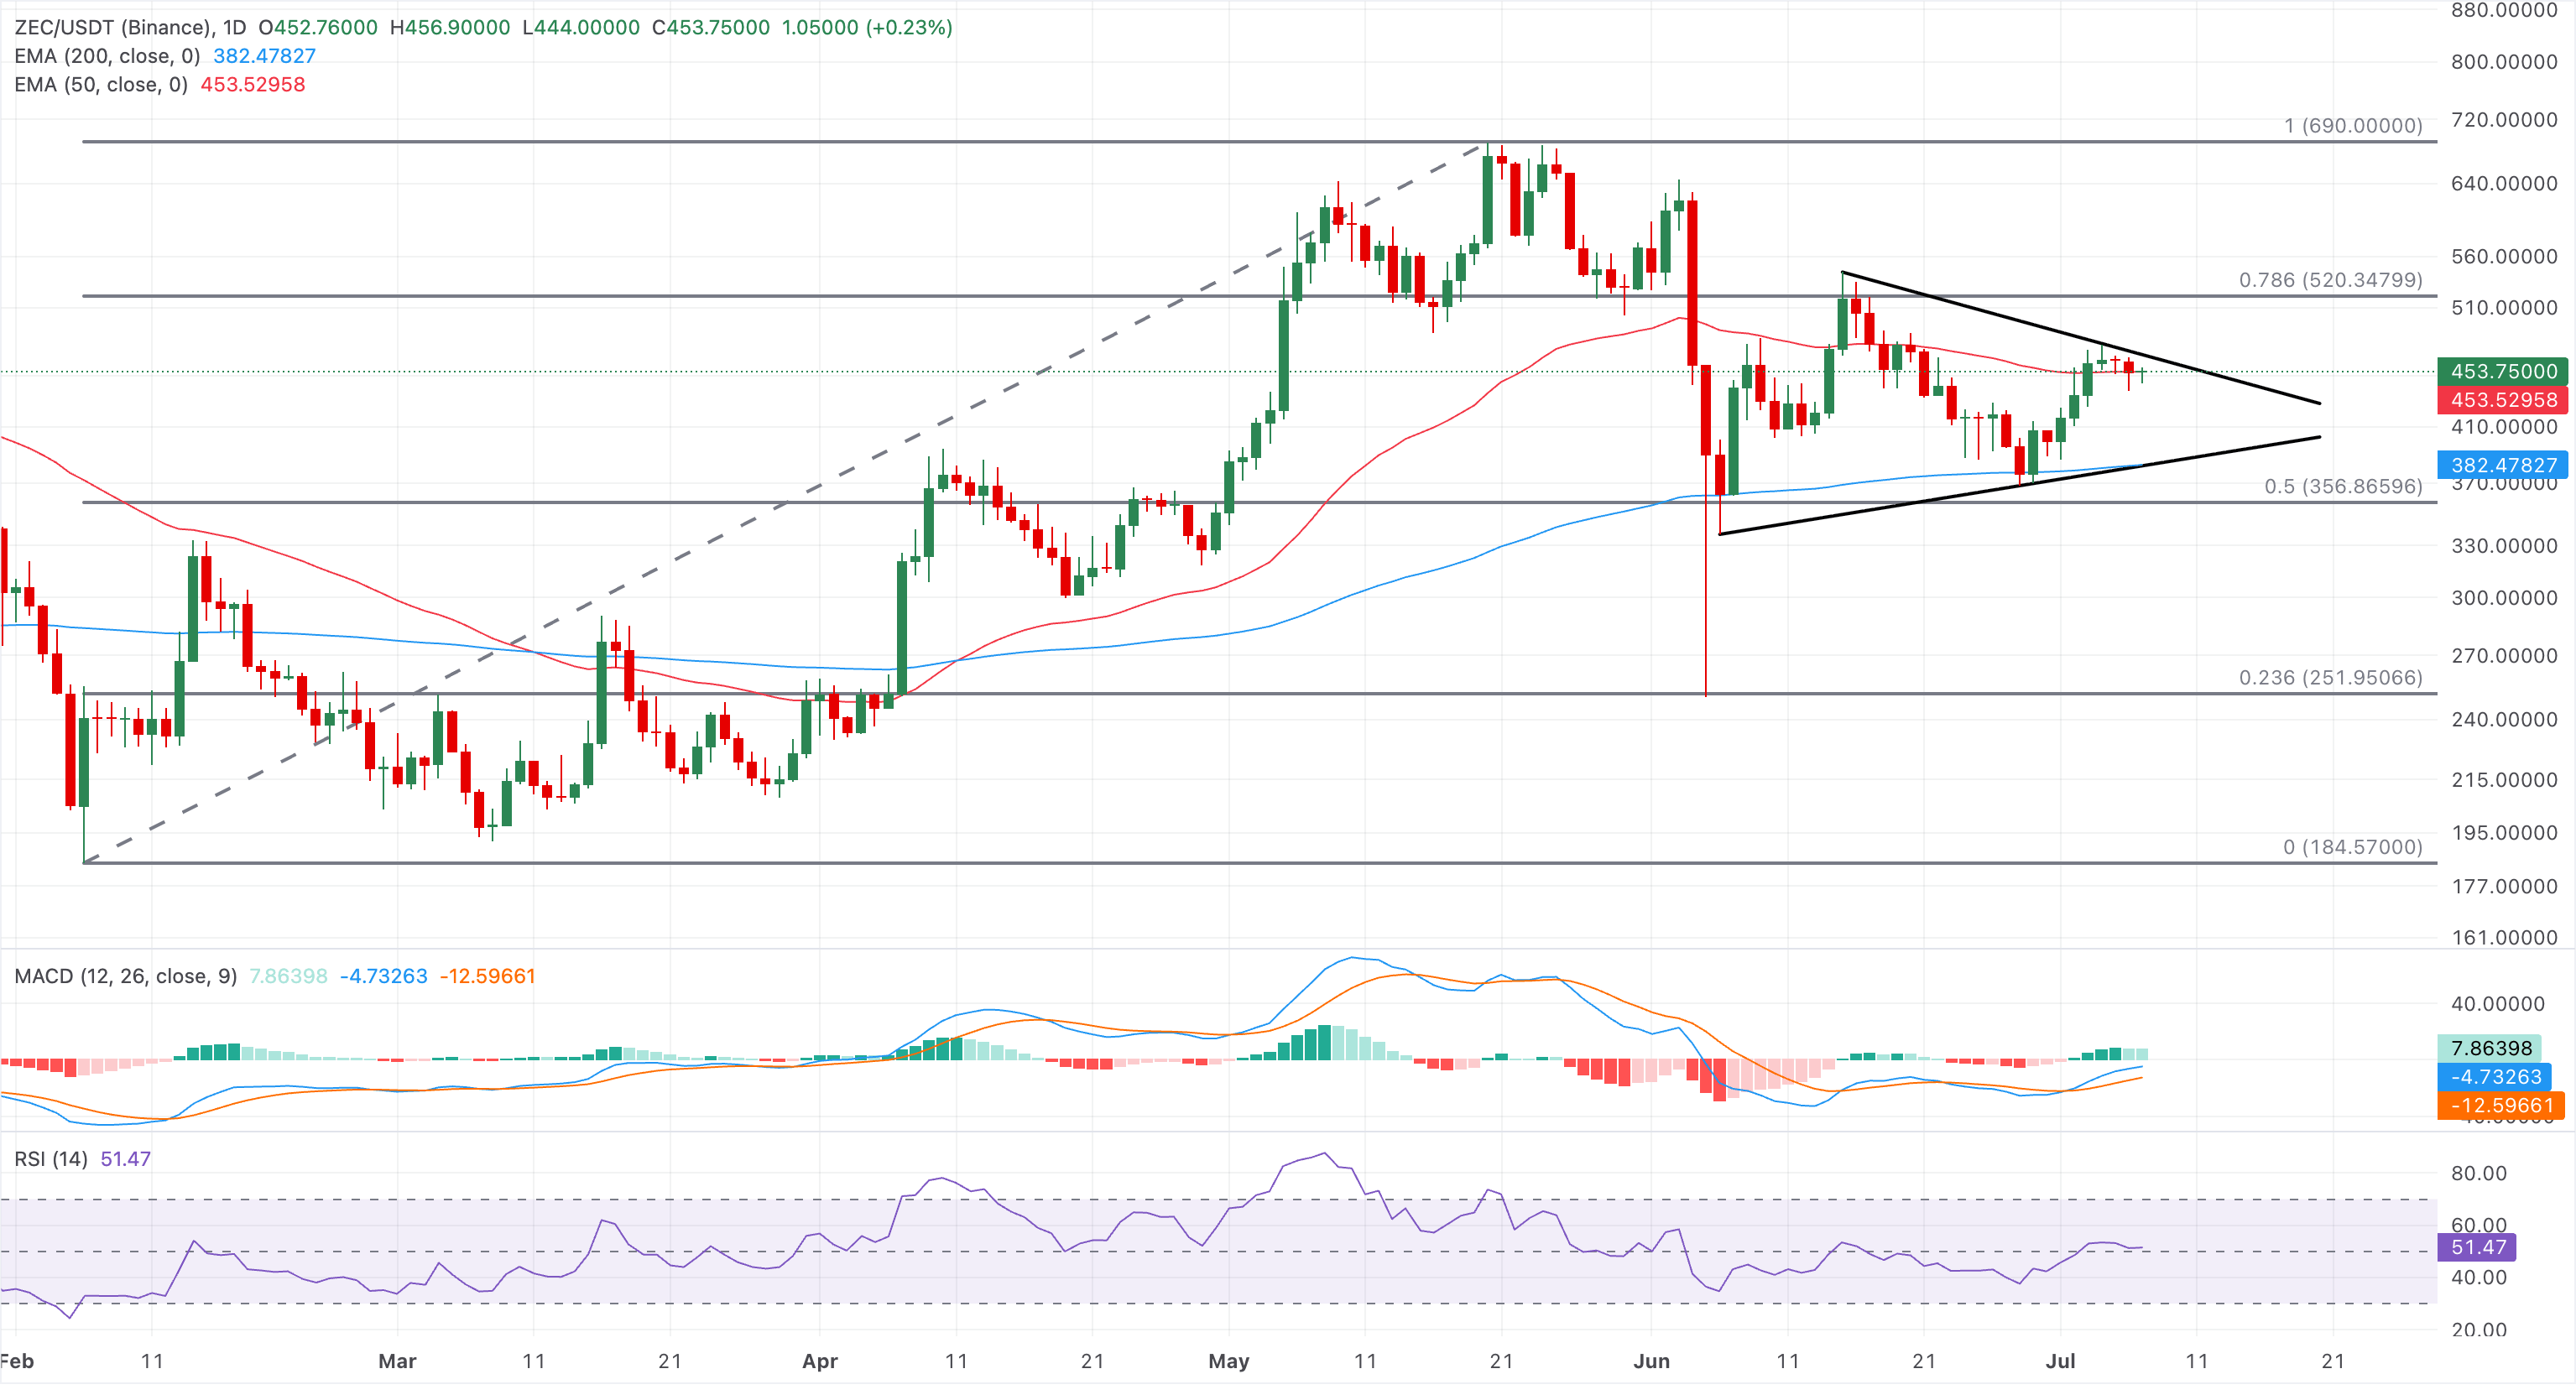
On the downside, immediate support is seen at a rising support trendline, close to the 200-day EMA at $382, which is further supported by the 50% Fibonacci retracement at $437.
(The technical analysis of this story was written with the help of an AI tool. Know more.)














