

Сауда
Бәсекеге қабілетті бағалар, жоғары өтімділік және озық сауда құралдары арқылы нарықтардың кең ауқымын зерттеңіз.
Толығырақ 
Платформа
TMGM-нің жылдамдыққа, дәлдікке және жоғары деңгейлі сауда тәжірибесіне арналған қуатты платформасымен сауданы кедергісіз жүргізіңіз.
Толығырақ Сауда платформасы
Академия
Бастауыштарға арналған нұсқаулықтар, вебинарлар және нарық талдаулары сияқты ресурстар арқылы сауданың негіздерін үйреніңіз.
Толығырақ TMGM Академиясы
Жаңалықтар және талдау
Сауда мүмкіндіктерінен алда болу үшін нақты уақыттағы нарық жаңартулары мен сараптамалық талдауды алыңыз
Толығырақ Жаңалықтар және талдау
Туралы
TMGM-ді ерекшелендіретін жайттарды біліңіз — біздің жаһандық ауқымымыз, реттеушілік беріктігіміз және трейдингтегі инновацияларға деген адалдығымыз.
Толығырақ Неліктен TMGM-ді таңдау керек
Crypto Today: Bitcoin, Ethereum and XRP extend losses as post-midterm elections rally reverses
- Bitcoin drops sharply and trades below $76,000 amid concerns that Democrats will take control of the US Congress in January.
- Ethereum hovers near $2,200 support amid a structurally capped upside.
- XRP dips below $1.20, weighed down by deteriorating momentum indicators.
Cryptocurrency prices are broadly correcting on Friday, with Bitcoin (BTC) sitting below $76,000. Ethereum (ETH) edges lower near the psychological $2,200 demand area, as bears tighten their grip. Ripple (XRP) paints a similar grim picture, falling below $1.20.
US midterms weigh on the crypto market
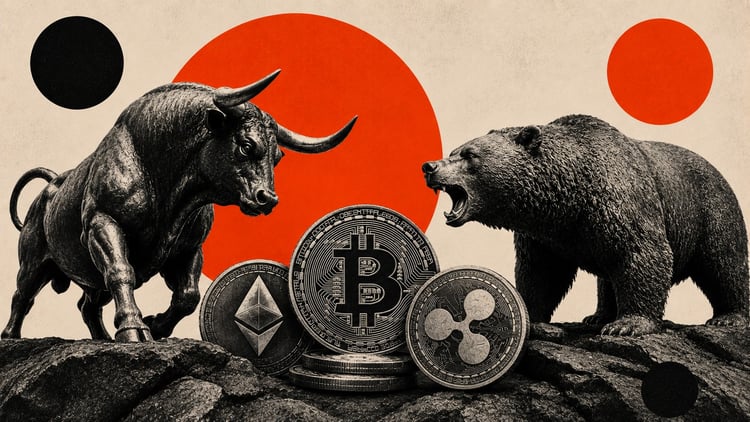
The United States (US) midterm elections have left behind a storm of concerns after the Democratic Party edged Republicans, taking control of Congress. From January, Democrats will hold majorities in both the House of Representatives and the Senate, a situation many foresee could block key crypto regulations and slow the advancement of Artificial Intelligence (AI) in the world’s largest economy.
Senator Elizabeth Warren, a leading crypto critic, is expected to chair the US Senate Banking Committee as of early 2027, with focus likely to shift to crypto regulations, given that she is a longtime advocate for stricter rules, according to a Wall Street Journal report.
The report highlights that Warren’s initial priorities may include launching investigations into alleged insider trading in prediction markets, reviewing consumer protection practices in crypto entities, and evaluating alleged conflicts of interest involving US President Donald Trump and his family. Although Warren's position as Senate Banking Committee Chair is yet to be confirmed, observers say the odds of another candidate are low.
“Democrats won this election by claiming we are on the side of working people, and working people are counting on us to deliver,” Senator Warren wrote in an opinion piece in Time on Thursday.
The US CLARITY Act stalled in the Senate on September 15 after a procedural motion to bring the bill to the Senate floor failed 49-50, well short of the 60-vote threshold needed to advance. Democrats have been called out for blocking the bill’s progress, and with them as the majority in Congress, many fear that crypto regulations could either take a back seat or reverse the gains that have been made since Trump took office in 2024.
Crypto In America reports that the Democratic Party is discussing reviving crypto investor-protection legislation, with room to expand it into a comprehensive digital market structure bill.
“Additional ethics provisions are also expected, targeting crypto-related activities by President Trump and other federal officials,” Crypto In America reported, adding, “The issue was a major sticking point in negotiations over the Clarity Act and helped drive the legislation’s collapse in September, when all Senate Democrats voted against advancing it.”
Still, getting new bills through Congress is one thing; getting them to become law is a totally different uphill task, as Trump retains veto power for the next two years. Overriding the President’s veto power will require Republican support.
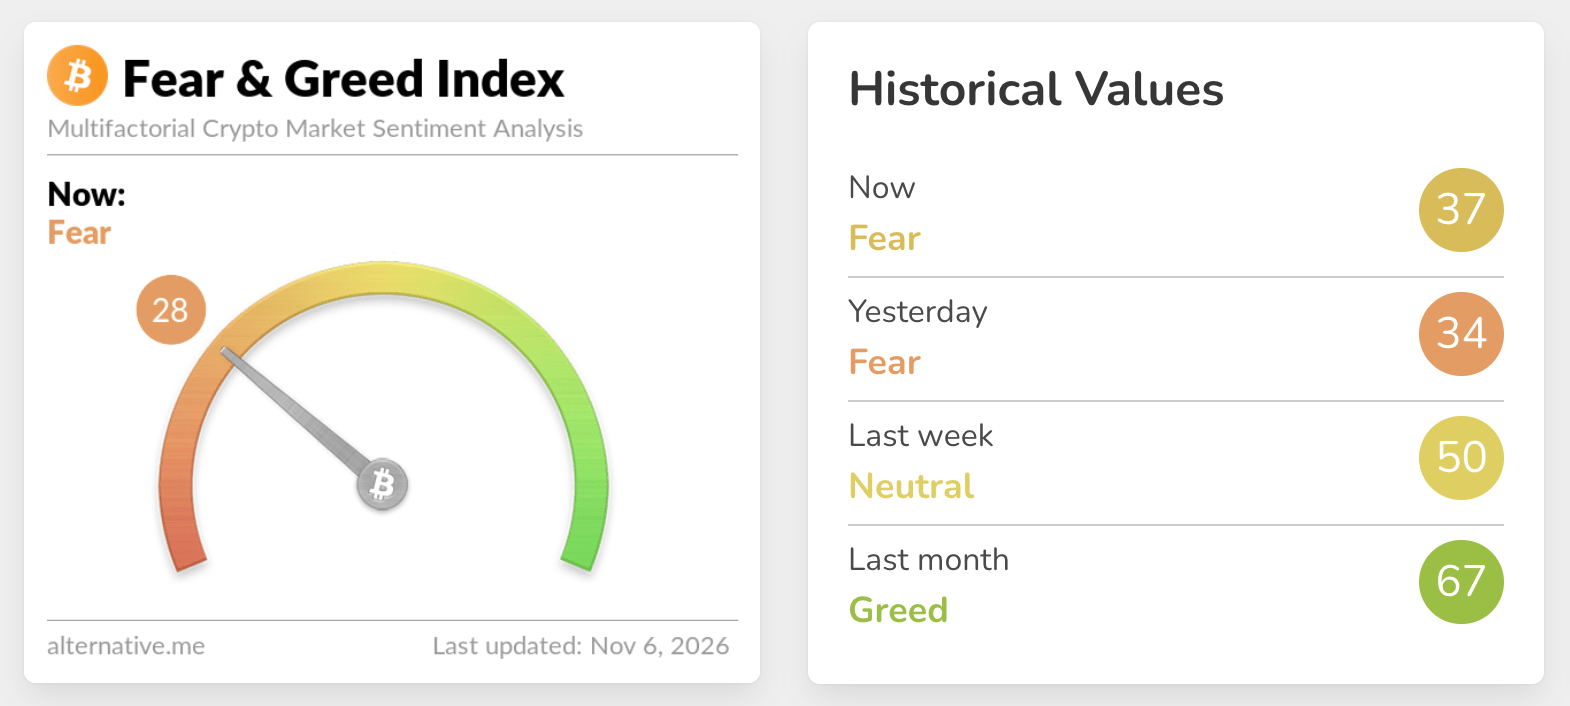
Crypto market sentiment continues to deteriorate, with the Fear & Greed Index falling to 28 in the Fear territory on Friday, from 37 in the same range the day before. Looking back, the index averaged 67 in the Greed region last month, suggesting appetite for crypto-related digital investment products is shrinking.
Technical analysis: Bitcoin bears tighten grip
Bitcoin trades at $75,712, with a bearish near-term bias as price holds below a stack of key moving averages. The pair is capped beneath the 200-day Exponential Moving Average (EMA) at $76,504, the 100-day EMA at $77,770 and the 50-day EMA near $79,821, reinforcing the overhead supply zone.
Momentum indicators support this soft tone, with the Relative Strength Index (RSI) hovering around 38 in bearish territory and the Moving Average Convergence Divergence (MACD) line negative, suggesting rallies are likely to struggle into resistance.
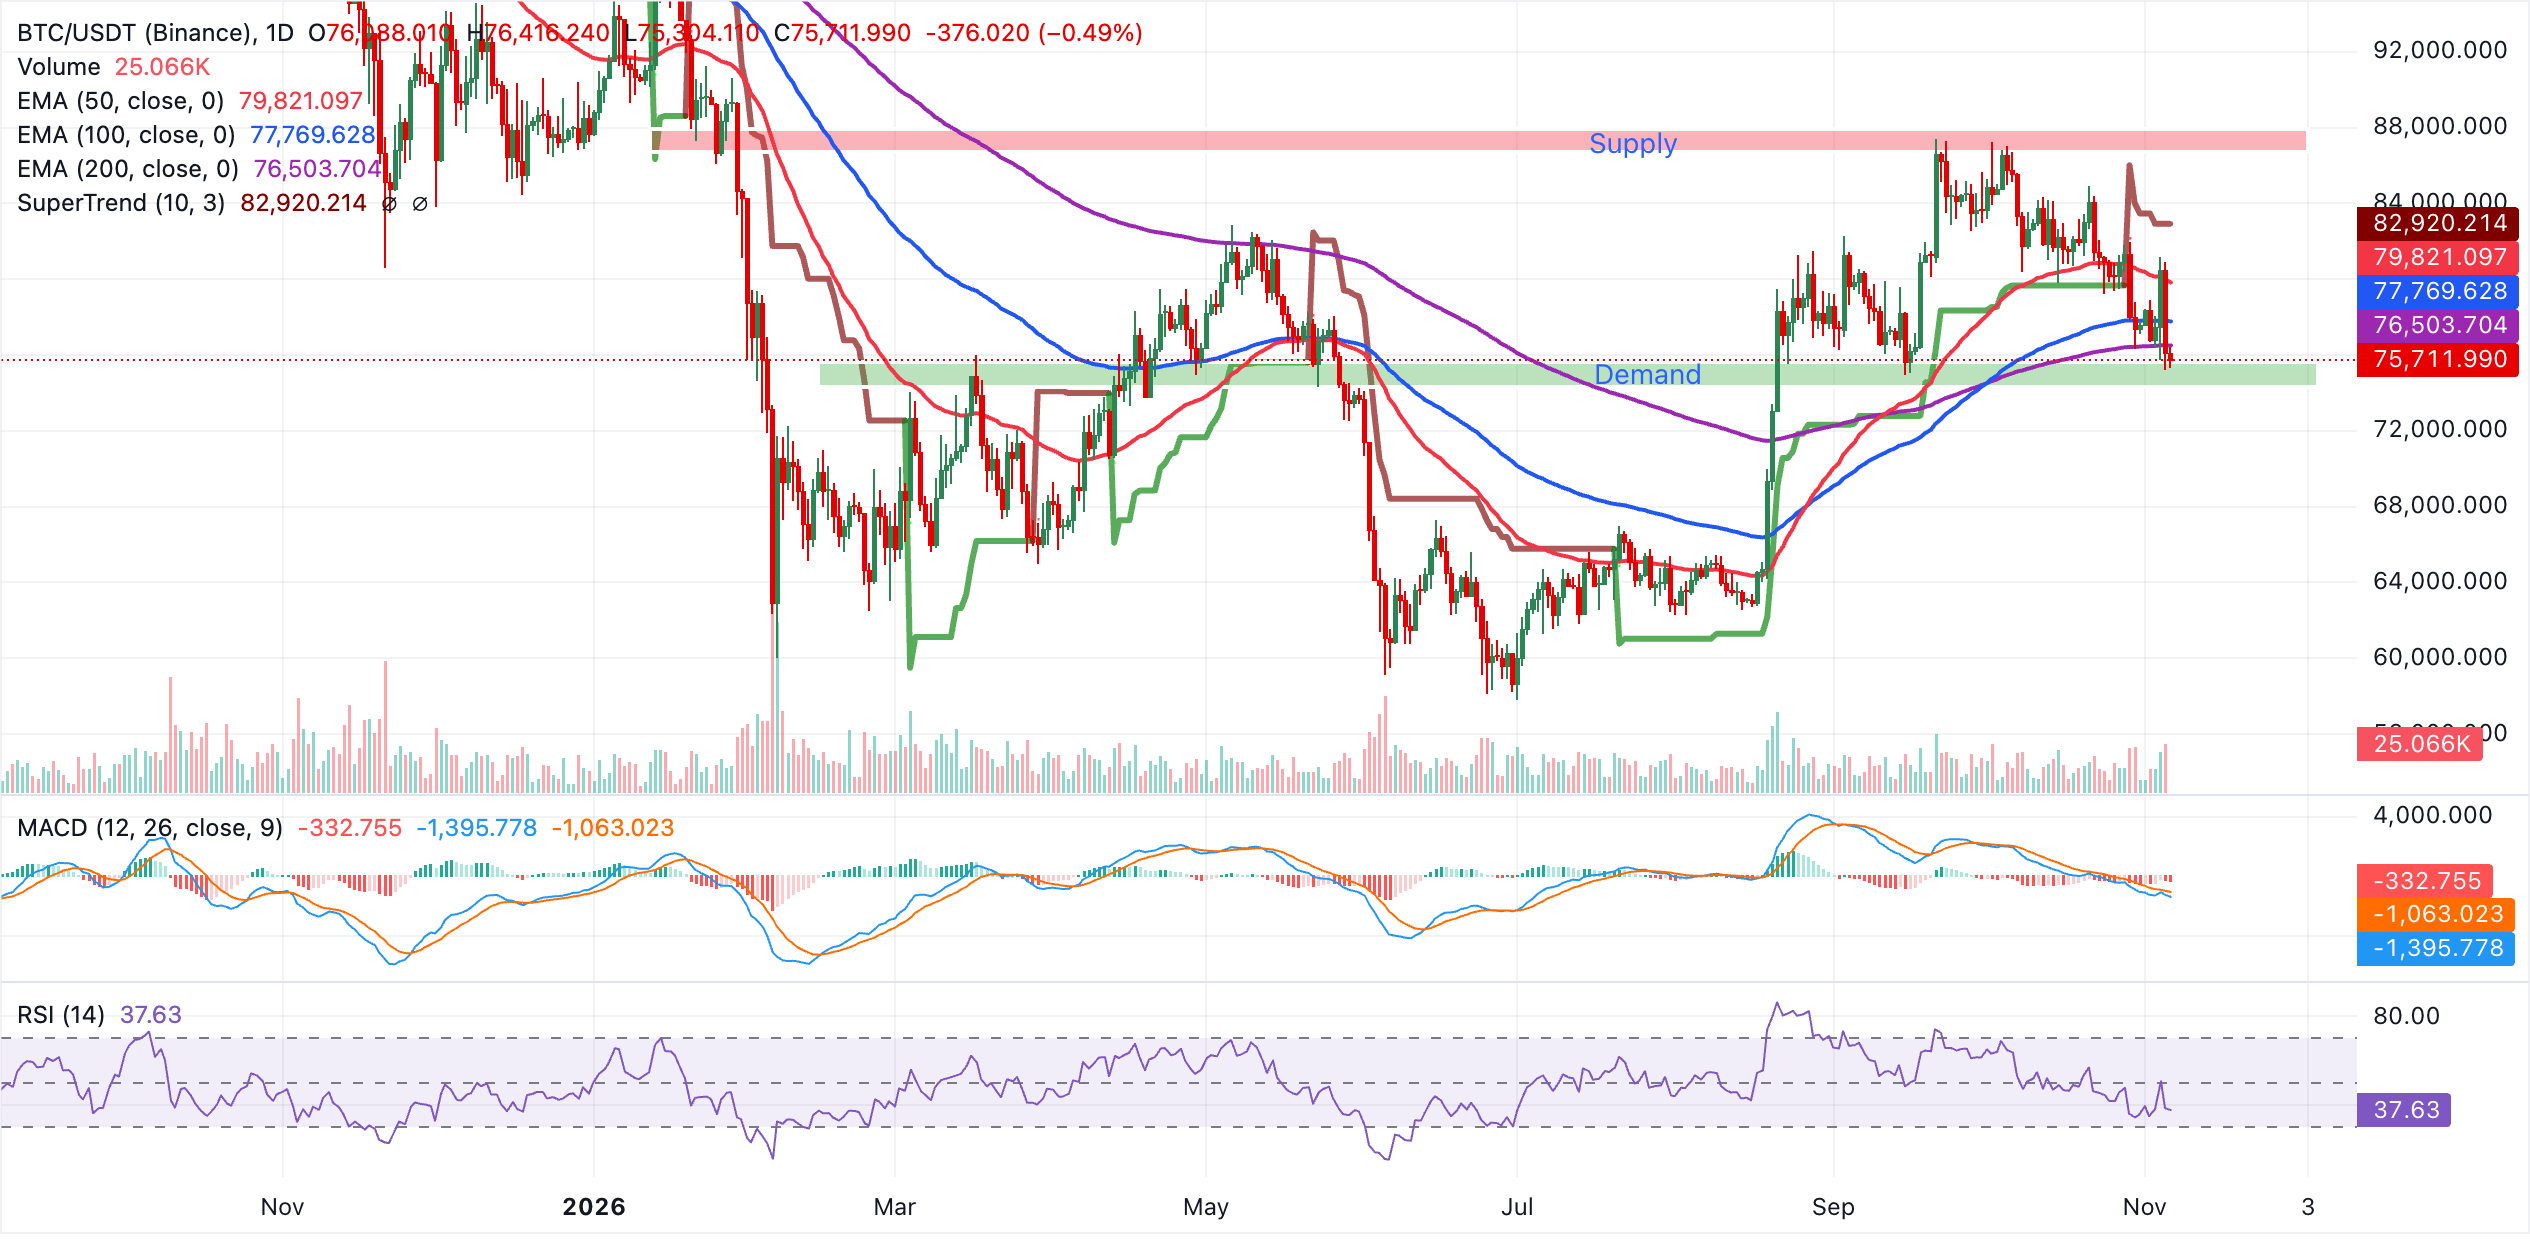
On the topside, bulls would first need to reclaim the 200-day EMA at $76,504 to ease immediate pressure, with the 100-day EMA at $77,770 acting as the next barrier. Above that, the 50-day EMA at $79,821 is the next resistance, while the SuperTrend line at $82,920 marks a more distant cap unlikely to be challenged unless momentum improves materially.
Ethereum technical analysis: ETH tests key support
Ethereum edges lower near the pivotal $2,200 demand area after erasing US midterm election gains that propelled the smart contract token above $2,400 earlier in the week. Price holds below key EMAs, clustered between $2,300 and $2,400, reinforcing a strong bearish bias. Momentum is largely bearish, as reflected in the RSI at 38 on the daily chart and the MACD in the negative region. The SuperTrend line at $2,490 weighs on ETH's technical structure, suggesting that the path of least resistance is downward.
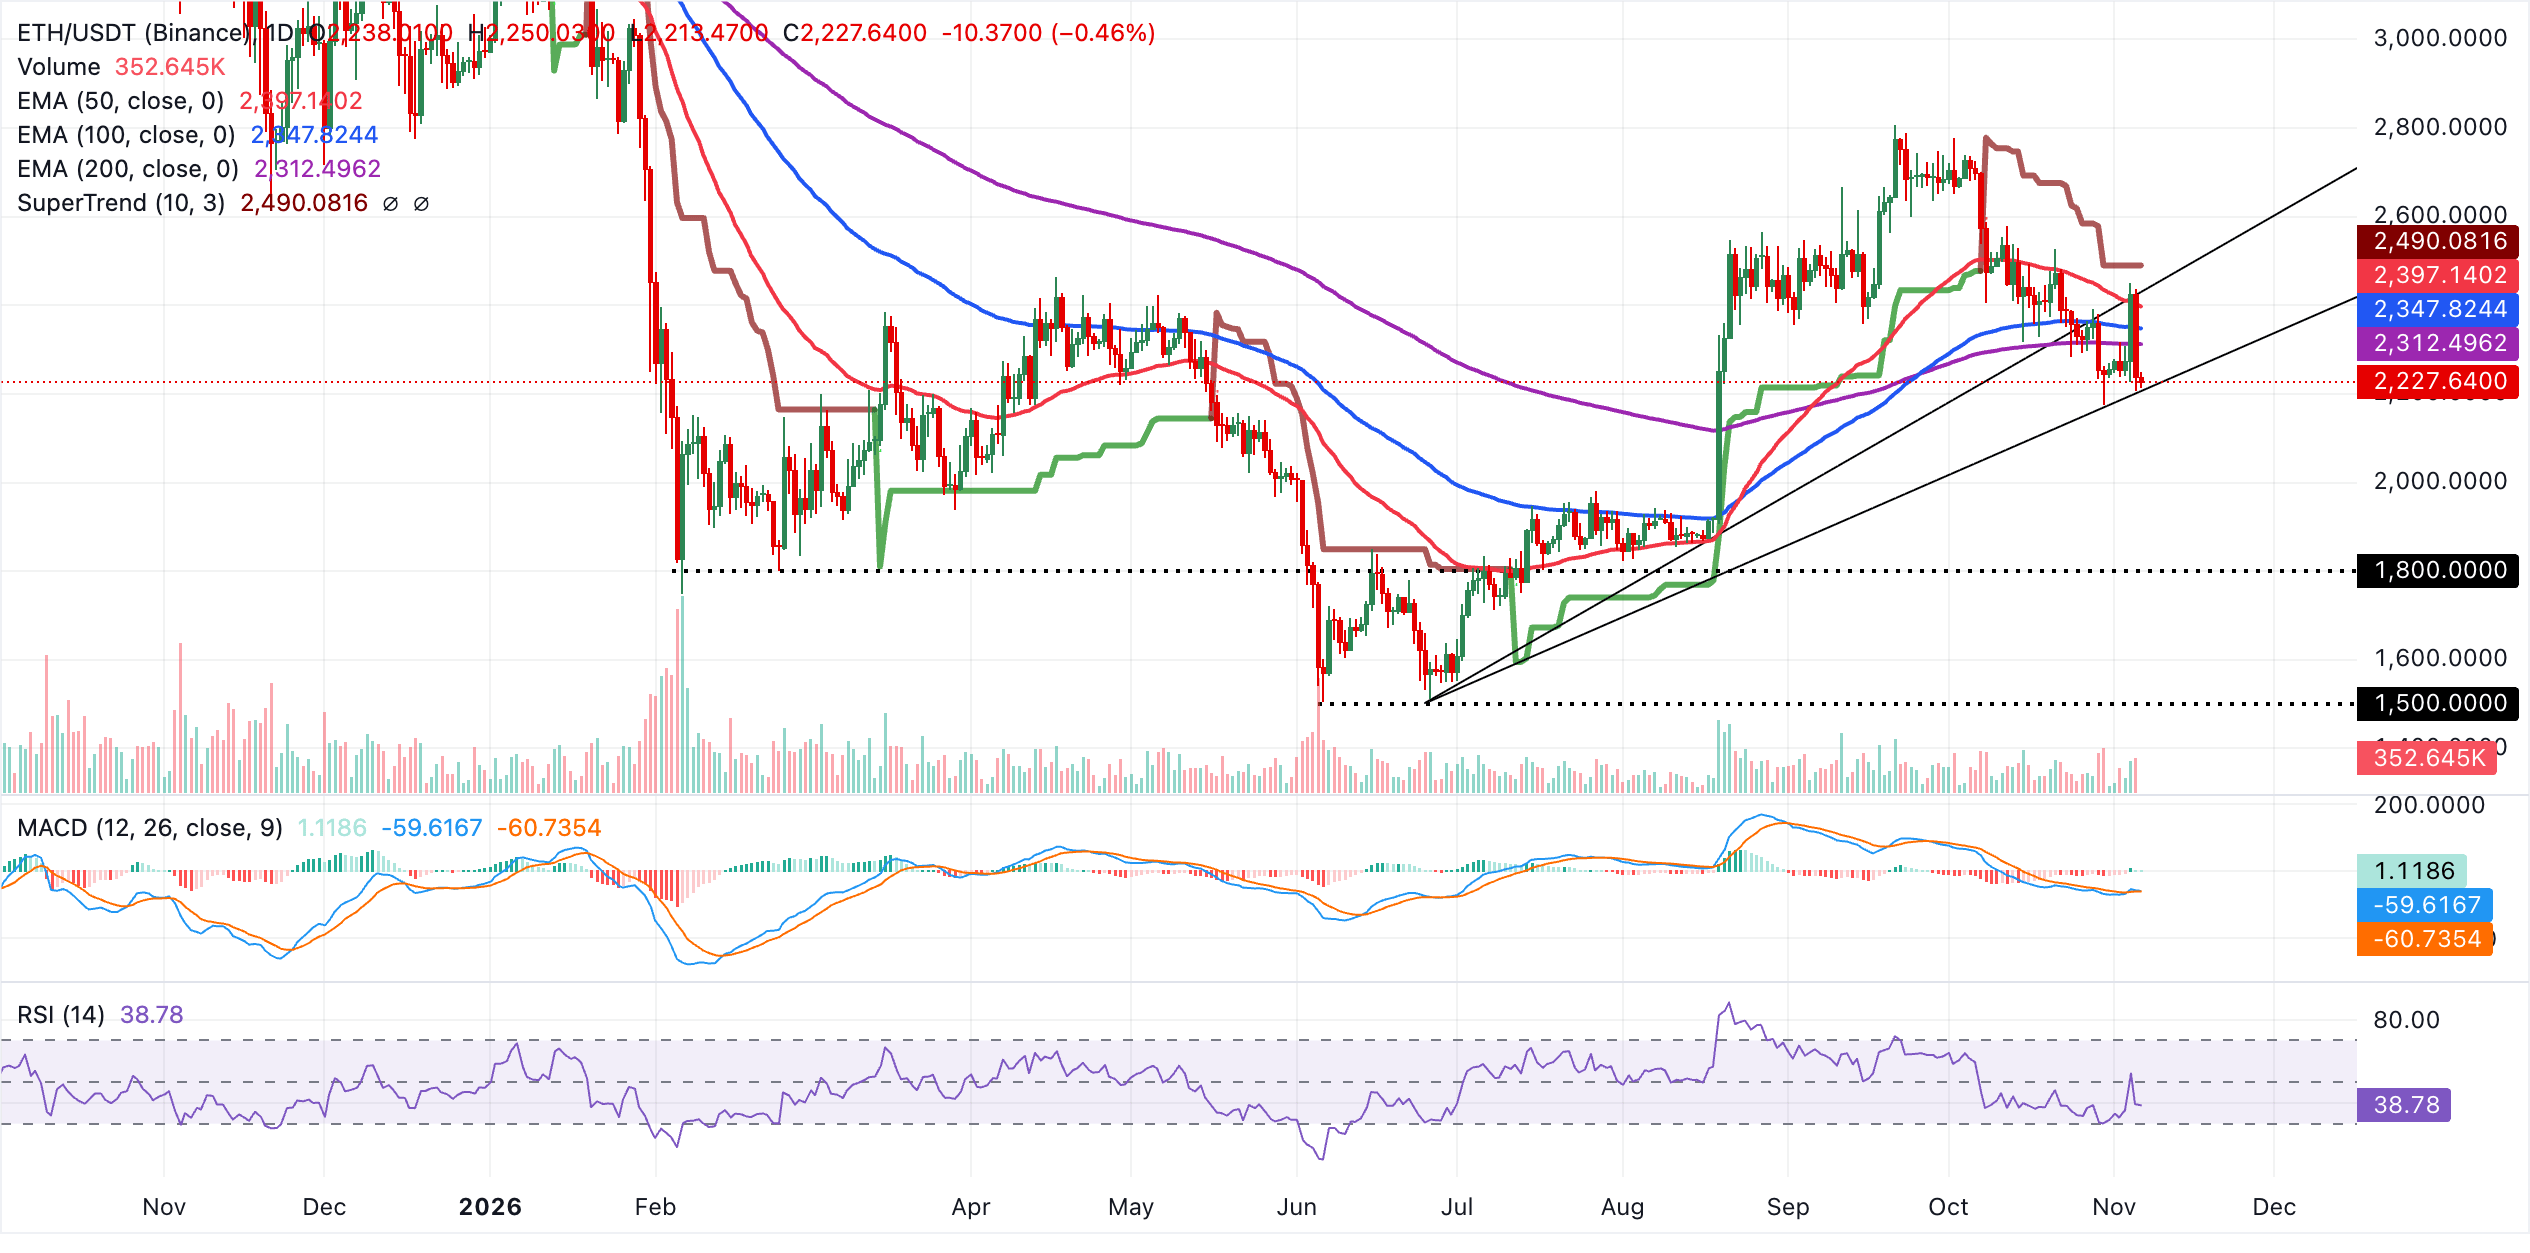
Initial support is the buyer congestion zone at $2,200, where traders will likely step in to reposition for the next recovery attempt after the dust settles. Below this level, Ethereum may be forced to seek liquidity toward $2,000. On the topside, the 200-day EMA highlights a short-term hurdle at $2,312, followed by the 100-day EMA at $2,348 and the 50-day EMA at $2,397. A daily close above this moving average cluster would signal a potential bullish turnaround.
Technical analysis: XRP correction persists
XRP trades below $1.20, maintaining a bearish near-term bias as price holds below key moving averages and within the lower half of the Bollinger Bands. The 50-day, 100-day and 200-day EMAs, clustered between roughly $1.32 and $1.36, sit well above spot and reinforce a capped structure despite a mild pickup in recent sessions.
Momentum remains fragile, with the RSI hovering just above oversold territory near 35 and the MACD line marginally below zero, both hinting that downside pressure persists even as the selloff slows.
Initial resistance lies at the lower Bollinger Band near $1.20, with the Bollinger middle band around $1.29 acting as the next hurdle if buyers manage a corrective bounce. Above that, the 100-day EMA at $1.32 and the 50-day EMA at $1.33 create a dense supply zone ahead of the 200-day EMA near $1.36 and the upper Bollinger Band around $1.37. The lack of nearby chart-based support below current levels leaves XRP vulnerable to further weakness if $1.20 breaks decisively.
(The technical analysis of this story was written with the help of an AI tool. Know more.)
Bitcoin, altcoins, stablecoins FAQs
Bitcoin is the largest cryptocurrency by market capitalization, a virtual currency designed to serve as money. This form of payment cannot be controlled by any one person, group, or entity, which eliminates the need for third-party participation during financial transactions.
Altcoins are any cryptocurrency apart from Bitcoin, but some also regard Ethereum as a non-altcoin because it is from these two cryptocurrencies that forking happens. If this is true, then Litecoin is the first altcoin, forked from the Bitcoin protocol and, therefore, an “improved” version of it.
Stablecoins are cryptocurrencies designed to have a stable price, with their value backed by a reserve of the asset it represents. To achieve this, the value of any one stablecoin is pegged to a commodity or financial instrument, such as the US Dollar (USD), with its supply regulated by an algorithm or demand. The main goal of stablecoins is to provide an on/off-ramp for investors willing to trade and invest in cryptocurrencies. Stablecoins also allow investors to store value since cryptocurrencies, in general, are subject to volatility.
Bitcoin dominance is the ratio of Bitcoin's market capitalization to the total market capitalization of all cryptocurrencies combined. It provides a clear picture of Bitcoin’s interest among investors. A high BTC dominance typically happens before and during a bull run, in which investors resort to investing in relatively stable and high market capitalization cryptocurrency like Bitcoin. A drop in BTC dominance usually means that investors are moving their capital and/or profits to altcoins in a quest for higher returns, which usually triggers an explosion of altcoin rallies.
Үздік мақалалар
1Crypto Today: Bitcoin, Ethereum and XRP extend losses as post-midterm elections rally reverses2What a Democratic Congress means for Bitcoin and crypto
regulation3Democrats win House and Senate in US midterms: Why isn’t all bad news for crypto4Eurozone Retail Sales (YoY) below expectations (0.6%) in September: Actual (0.4%)5Eurozone Retail Sales (MoM) registered at -0.7%, below expectations (-0.1%) in September6ECB's Lane: Energy inflation to influence wage negotiations7Fed's Williams: Appropriate time to accumulate more information8Czech Koruna: Limited CNB tightening keeps CZK under pressure - Commerzbank9Canada Unemployment Rate set to hold at 6.5% as hiring recovers

Бастау!
Тіркеліп, 3 минуттан аз уақытта жаһандық нарықтарға қол жеткізіңіз

Бізбен байланысыңыз









Байланыстар
Телефон: +61 2 8036 8388
Факс: +61 2 8036 8388
Эл. пошта: support@tmgm.com
Веб: https://www.tmgm.com



Осы веб-сайтта берілген ақпарат тек жалпы сипатта ғана ұсынылады және жеке қаржылық кеңес болып табылмайды. Осы веб-сайттағы кез келген ақпаратқа сүйенбес бұрын, оның сіздің мақсаттарыңызға, қаржылық жағдайыңызға және қажеттіліктеріңізге сәйкестігін бағалауыңыз керек. CFD және FX Margin Contracts-қа инвестиция салу елеулі тәуекелдермен байланысты және барлық инвесторлар үшін қолайлы емес. Сіз бастапқы салымыңыздан артық қаражат жоғалтуыңыз мүмкін. Сіз базалық активке ешқандай меншік құқығына немесе үлеске ие болмайсыз. Сауда жасамас бұрын тәуелсіз кеңес алуды және тәуекелдерді толық түсінуді ұсынамыз. Веб-сайтта көрсетілген кез келген өнімді сатып алмас бұрын, ақпараттық құжатты оқып, оны мұқият қарастыру маңызды. Осы веб-сайтта ұсынылған ақпарат пен жарнамалар жергілікті заңдар мен ережелерге қайшы келетін кез келген елде немесе юрисдикцияда тұратын адамдардың пайдалануына арналмаған. Осы веб-сайтта ұсынылатын Өнімдер мен Қызметтер Америка Құрама Штаттары, Малайзия және Таиланд тұрғындарына арналмаған.
TMGM әртүрлі юрисдикцияларда уәкілетті және реттеледі.
Trademax Australia Limited, TMGM атауымен жұмыс істейді, Австралияның Бағалы қағаздар және инвестициялар жөніндегі комиссиясымен (ASIC) реттеледі, AFSL № 436416 және мына мекенжайда орналасқан: Level 28, One International Tower, 100 Barangaroo Avenue, 2000 Sydney, NSW Australia.
Электрондық пошта: support@tmgm.com.au
Trademax Global Limited, TMGM атауымен жұмыс істейді, Вануату Қаржылық қызметтер комиссиясымен (VFSC) уәкілетті және реттеледі, тіркеу нөмірі 40356, тіркелген мекенжайы: 1276, Kumul Highway, Port Vila, Vanuatu, Republic of Vanuatu.
Электрондық пошта: support@tmgm.com
Trademax Global Markets (SE) Limited, TMGM атауымен жұмыс істейді, Сейшел аралдарының Қаржылық қызметтер басқармасы (FSA) тарапынан уәкілетті және реттеледі, лицензия нөмірі SD224. Компания мына мекенжайда тіркелген: Office No 13, Providence Estate ABIS Centre, Mahe, Seychelles.
Электрондық пошта: support@tmgm.com
Trademax Global Markets (International) Pty Ltd, TMGM атауымен жұмыс істейді, Mauritius Қаржылық қызметтер комиссиясымен (FSC) № GB22201012 лицензиясы бойынша уәкілетті және реттеледі, тіркелген мекенжайы: 33, Edith Cavell Street C/o IQ EQ Fund Services (Mauritius) Ltd Port Louis, 11324 Mauritius.
Электрондық пошта: support@tmgm.com
Авторлық құқық © TMGM. Барлық құқықтар қорғалған