

EUR/USD Price Forecast: Approaches 1.1600 as RSI shifts bullish
- EUR/USD trades near 19-day highs despite broader bearish bias.
- RSI turns bullish, signaling buyers are gaining recovery momentum
- Break above 1.1500 exposes 1.1542 and 1.1592 resistance.
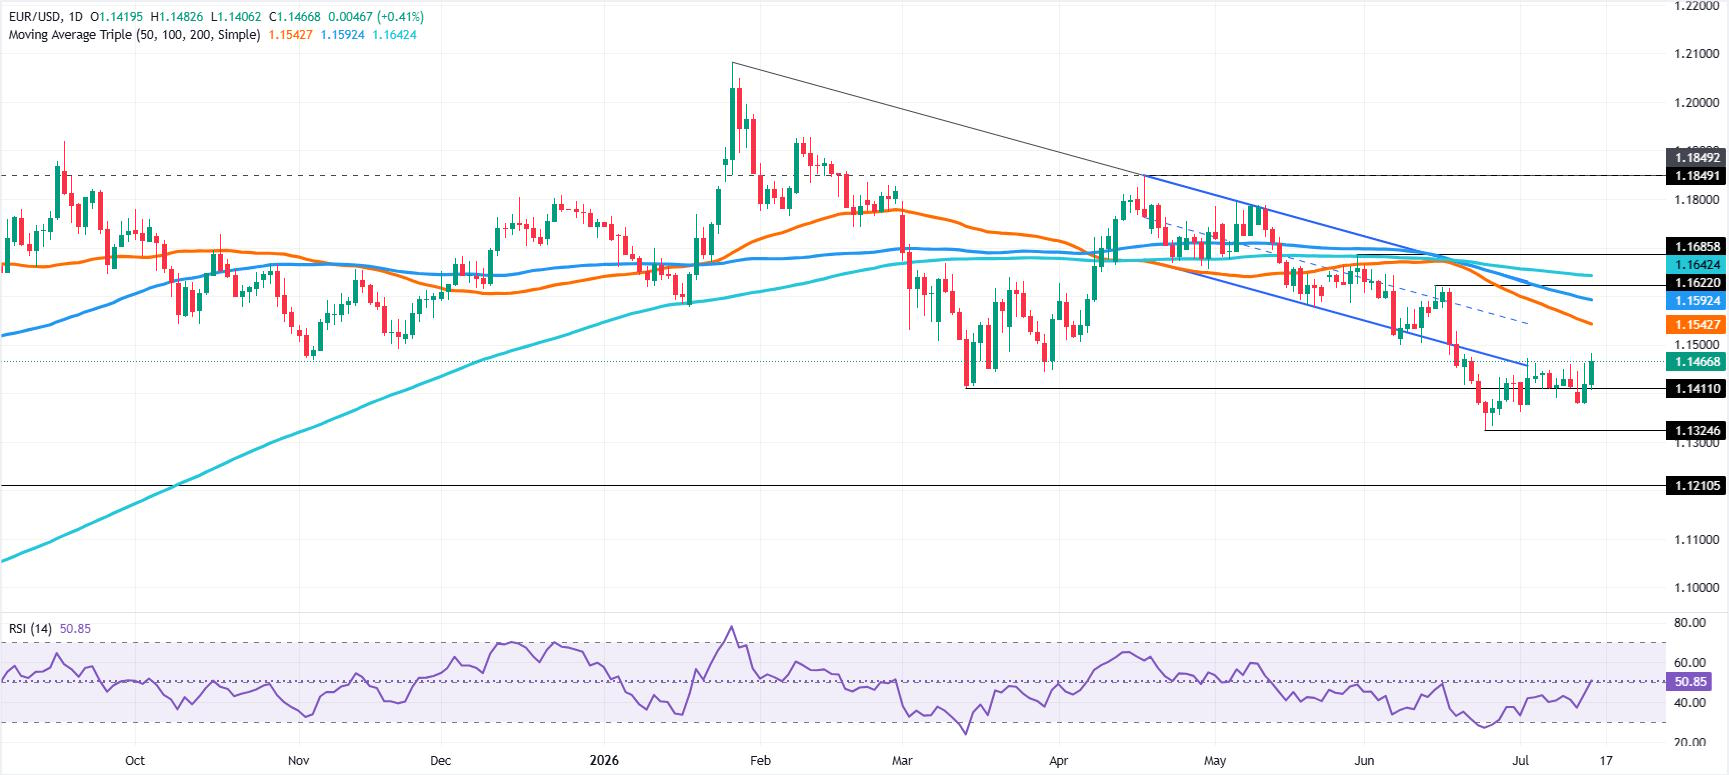
The EUR/USD advances some 0.41% on Wednesday, trading at 1.1466 after US inflation data was softer than expected, weighing on the Greenback, as market participants expect a less hawkish Federal Reserve. Towards the end of the year.
EUR/USD Price Forecast: Technical outlook
From a technical perspective, the EUR/USD is downwardly biased, even though it trades near 19-day highs. Momentum turned bullish, as indicated by the Relative Strength Index (RSI), which could open the door to a recovery, with buyers eyeing key technical resistance levels.

The first resistance for EUR/USD is the psychological 1.1500 level. Above lies the 50-day Simple Moving Average (SMA) at 1.1542, followed by the 100-day SMA at 1.1592 ahead of the 1.1600 mark. Upwards lies the 200-day SMA at 1.1642.
On the other hand, if EUR/USD dives below 1.1400, the next support would be the July 13 low of 1.1377. On further weakness, the next support would be the June 24 daily low at 1.1324, ahead of 1.1300.
EUR/USD Price Chart — Daily
Euro Price This week
The table below shows the percentage change of Euro (EUR) against listed major currencies this week. Euro was the strongest against the Japanese Yen.
| USD | EUR | GBP | JPY | CAD | AUD | NZD | CHF | |
|---|---|---|---|---|---|---|---|---|
| USD | -0.56% | -1.10% | 0.19% | -0.83% | -0.86% | -1.47% | -0.36% | |
| EUR | 0.56% | -0.56% | 0.80% | -0.27% | -0.35% | -0.92% | 0.22% | |
| GBP | 1.10% | 0.56% | 1.29% | 0.29% | 0.20% | -0.40% | 0.81% | |
| JPY | -0.19% | -0.80% | -1.29% | -1.12% | -1.07% | -1.72% | -0.62% | |
| CAD | 0.83% | 0.27% | -0.29% | 1.12% | 0.06% | -0.61% | 0.53% | |
| AUD | 0.86% | 0.35% | -0.20% | 1.07% | -0.06% | -0.57% | 0.47% | |
| NZD | 1.47% | 0.92% | 0.40% | 1.72% | 0.61% | 0.57% | 1.19% | |
| CHF | 0.36% | -0.22% | -0.81% | 0.62% | -0.53% | -0.47% | -1.19% |
The heat map shows percentage changes of major currencies against each other. The base currency is picked from the left column, while the quote currency is picked from the top row. For example, if you pick the Euro from the left column and move along the horizontal line to the US Dollar, the percentage change displayed in the box will represent EUR (base)/USD (quote).














