

GBP/JPY Price Forecast: Breaks support trendline, eyes on 217.50
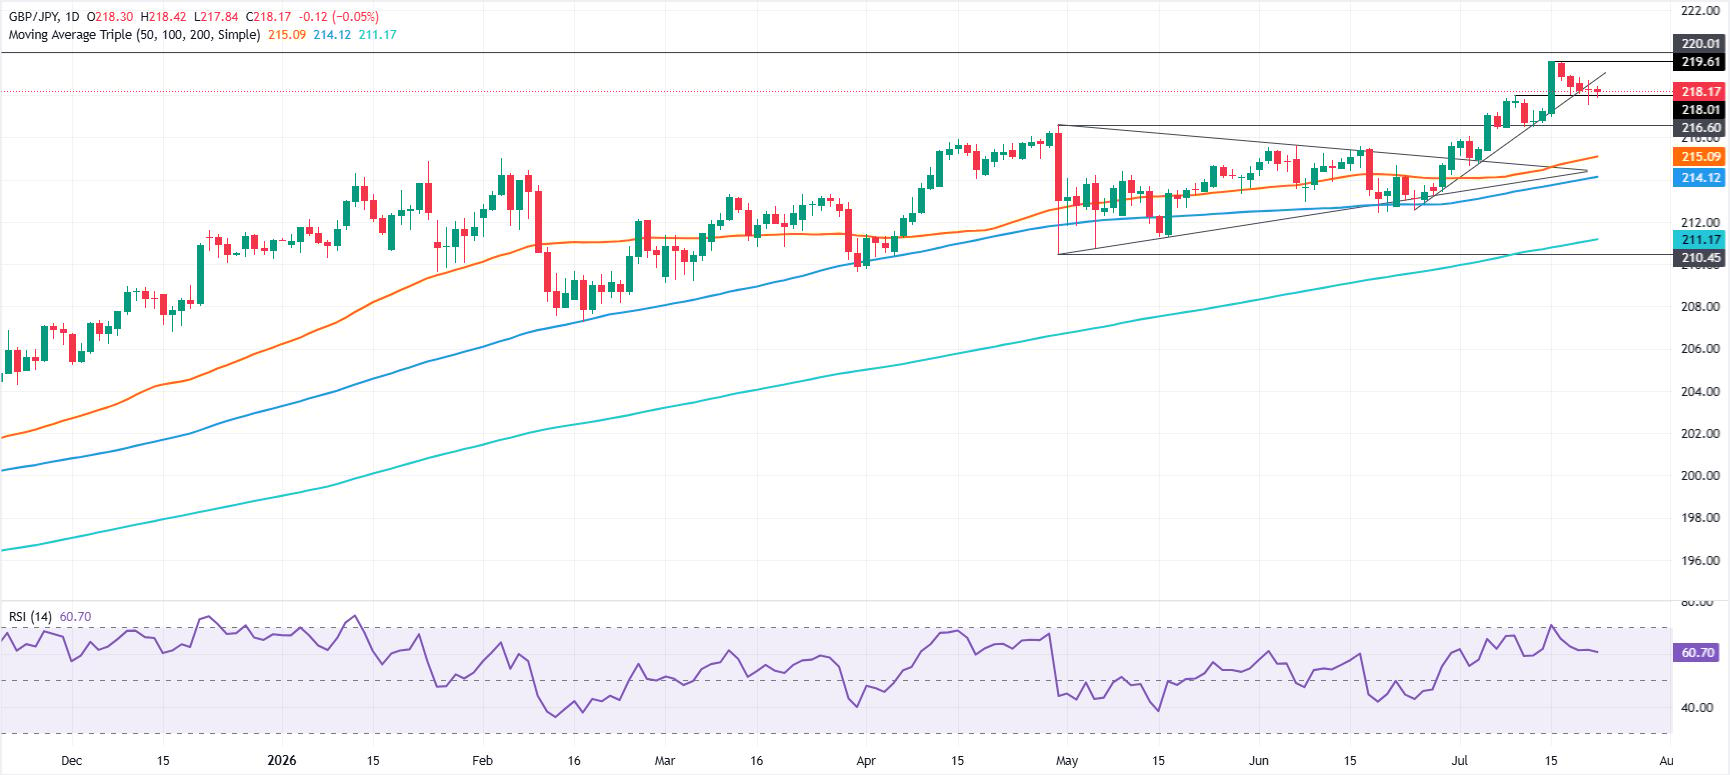
- GBP/JPY breaks support trendline, signaling downside risk below 218.00.
- RSI slopes toward 50, showing bullish momentum is fading.
- Break below 217.53 exposes 216.60 and 215.09 SMA.
GBP/JPY holds firm on Wednesday, with the cross-pair trading above the 218.00 figure, as sellers seem to have the upper hand, after a break of a key support trendline, which could open the door for further losses. At the time of writing, the cross trades at 218.16, down 0.05%.
GBP/JPY Price Forecast: Technical outlook

After reaching a yearly high of 219.61, GBP/JPY retreated 150 pips to the current exchange rate, opening the door for further downside.
The Relative Strength Index (RSI) remains bullish, but it is aiming lower, approaching the 50-neutral level, which could open the door to further downside. However, the market structure suggests that the downtrend stays intact.
For a bearish reversal, if GBP/JPY drops below the July 21 daily low of 217.53. A breach of the latter will expose the April 30 high of 216.60, followed by the 216.00 mark. Below, the next support would be the 50-day Simple Moving Average (SMA) at 215.09, followed by the 100-day SMA at 214.12.
Conversely, if GBP/JPY reaches 219.00, this opens the door to challenge the year-to-date (YTD) high at 219.61, followed by the 220.00 psychological level.
GBP/JPY Price Chart – Daily
Japanese Yen Price This week
The table below shows the percentage change of Japanese Yen (JPY) against listed major currencies this week. Japanese Yen was the strongest against the Swiss Franc.
| USD | EUR | GBP | JPY | CAD | AUD | NZD | CHF | |
|---|---|---|---|---|---|---|---|---|
| USD | 0.15% | 0.61% | 0.51% | 0.51% | -0.41% | 0.32% | 0.76% | |
| EUR | -0.15% | 0.46% | 0.28% | 0.37% | -0.56% | 0.17% | 0.61% | |
| GBP | -0.61% | -0.46% | -0.17% | -0.11% | -1.01% | -0.29% | 0.19% | |
| JPY | -0.51% | -0.28% | 0.17% | 0.09% | -0.86% | -0.20% | 0.37% | |
| CAD | -0.51% | -0.37% | 0.11% | -0.09% | -0.87% | -0.31% | 0.30% | |
| AUD | 0.41% | 0.56% | 1.01% | 0.86% | 0.87% | 0.73% | 1.21% | |
| NZD | -0.32% | -0.17% | 0.29% | 0.20% | 0.31% | -0.73% | 0.48% | |
| CHF | -0.76% | -0.61% | -0.19% | -0.37% | -0.30% | -1.21% | -0.48% |
The heat map shows percentage changes of major currencies against each other. The base currency is picked from the left column, while the quote currency is picked from the top row. For example, if you pick the Japanese Yen from the left column and move along the horizontal line to the US Dollar, the percentage change displayed in the box will represent JPY (base)/USD (quote).














