

GBP/JPY Price Forecast: Rallies and hits 18-year highs above 217.00
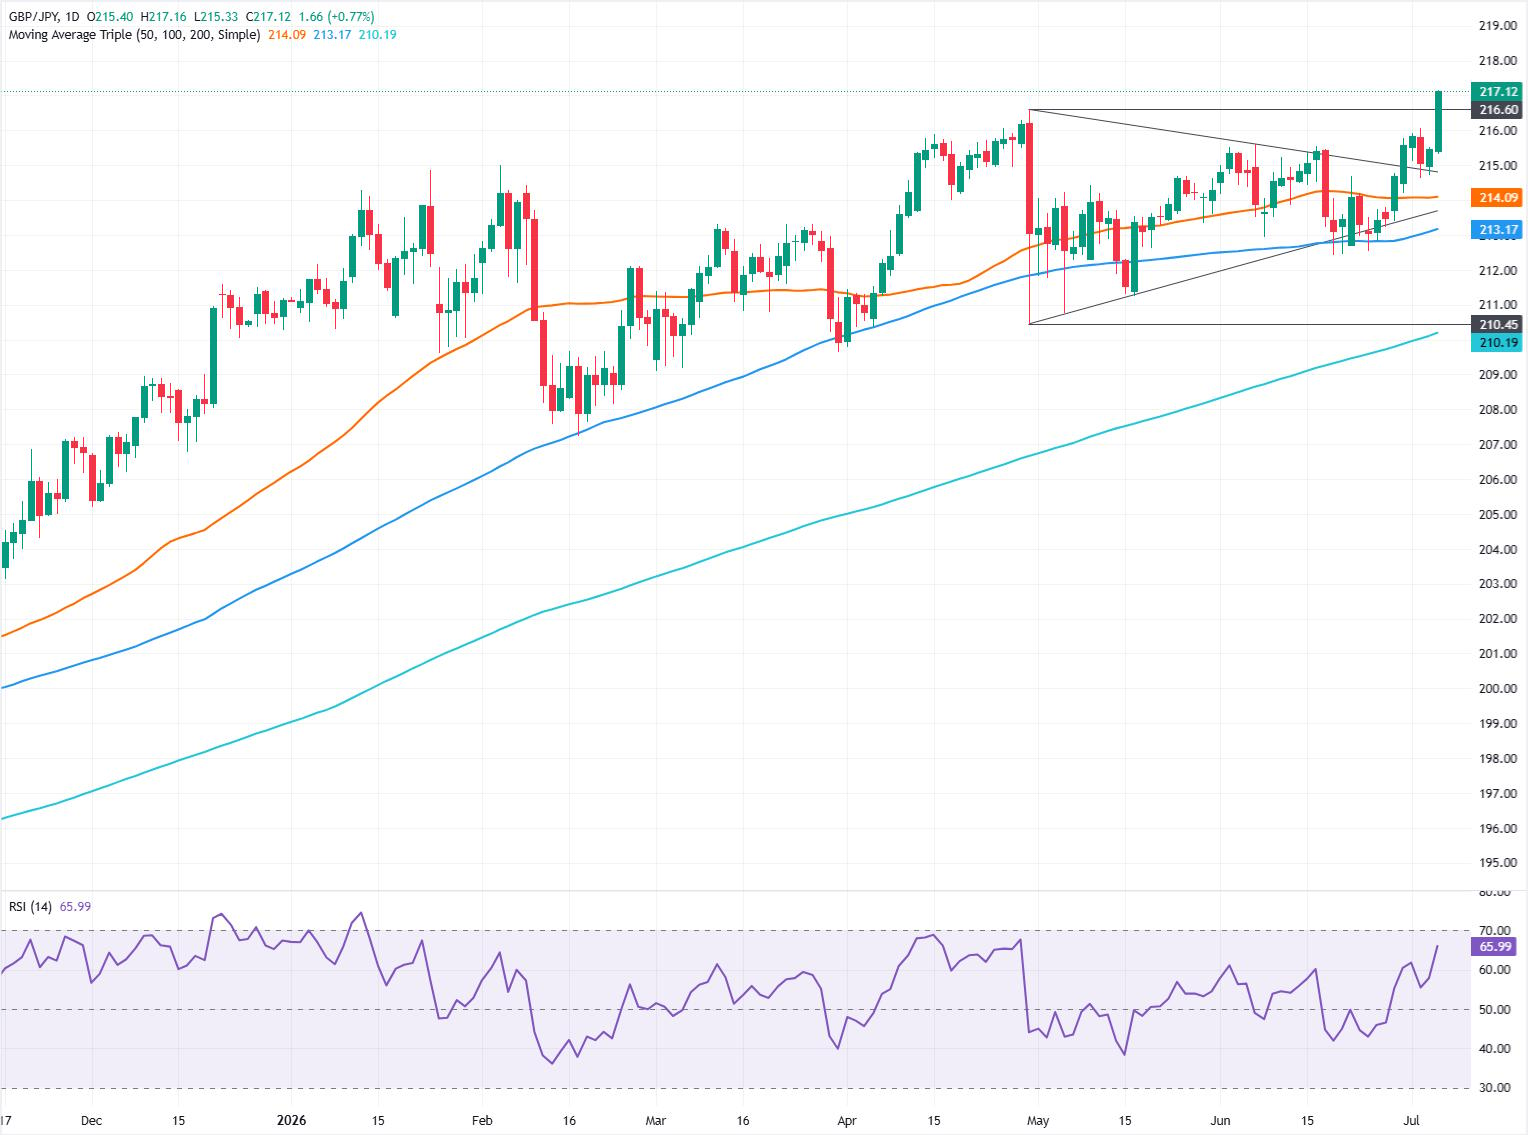
- GBP/JPY clears YTD high, confirming bullish breakout above 217.00.
- RSI nears overbought territory, hinting at short-term consolidation risk.
- Break above 217.50 exposes 218.00 and 220.00 resistance levels.
The British Pound rallies to an 18-year high against the Japanese Yen, registering solid gains of over 0.77% as the GBP/JPY clears the previous year-to-date (YTD) high of 216.60 as the cross-pair clears the 217.00 figure for the first time since January 2008. At the time of writing, the GBP/JPY trades at 217.11.

GBP/JPY Price Forecast: Technical outlook
The GBP/JPY formed a ‘bullish harami’ chart pattern on Friday, also known in the West as an ‘inside day’, which opened the door for further upside, once the pair cleared the July 2 high of the day (HOD) at 216.08, which exacerbated the leg-up past the 217.00 milestone.
The Relative Strength Index (RSI) remains bullish, as the index aims upwards, closing to overbought territory at the 70 level. This can pave the way for some consolidation before the uptrend continues.
The path of least resistance for the GBP/JPY is upwards. The first resistance is the 217.50 area. Above this level, the next stop would be the 218.00 figure, followed by the 220.00 psychological level.
Conversely, for a bearish reversal, the GBP/JPY must drop below the 215.00 psychological level, followed by the July 3 low of the day (LOD) at 214.72. On further weakness, the next area of interest would be the 50-day Simple Moving Average (SMA) at 214.09, followed by the 100-day SMA at 213.17.
GBP/JPY Chart - Daily
Japanese Yen Price This week
The table below shows the percentage change of Japanese Yen (JPY) against listed major currencies this week. Japanese Yen was the strongest against the Canadian Dollar.
| USD | EUR | GBP | JPY | CAD | AUD | NZD | CHF | |
|---|---|---|---|---|---|---|---|---|
| USD | -0.02% | -0.02% | -0.02% | 0.02% | 0.01% | -0.00% | 0.01% | |
| EUR | 0.02% | -0.01% | 0.00% | 0.05% | -0.01% | -0.01% | 0.00% | |
| GBP | 0.02% | 0.00% | 0.02% | 0.07% | 0.01% | 0.02% | 0.02% | |
| JPY | 0.02% | 0.00% | -0.02% | 0.03% | -0.04% | -0.03% | -0.04% | |
| CAD | -0.02% | -0.05% | -0.07% | -0.03% | -0.00% | -0.06% | -0.04% | |
| AUD | -0.01% | 0.00% | -0.01% | 0.04% | 0.00% | 0.00% | -0.02% | |
| NZD | 0.00% | 0.01% | -0.02% | 0.03% | 0.06% | -0.01% | -0.00% | |
| CHF | -0.01% | -0.01% | -0.02% | 0.04% | 0.04% | 0.02% | 0.00% |
The heat map shows percentage changes of major currencies against each other. The base currency is picked from the left column, while the quote currency is picked from the top row. For example, if you pick the Japanese Yen from the left column and move along the horizontal line to the US Dollar, the percentage change displayed in the box will represent JPY (base)/USD (quote).














