

GBP/JPY Price Forecast: Retreats from 18-year high, struggles at 220
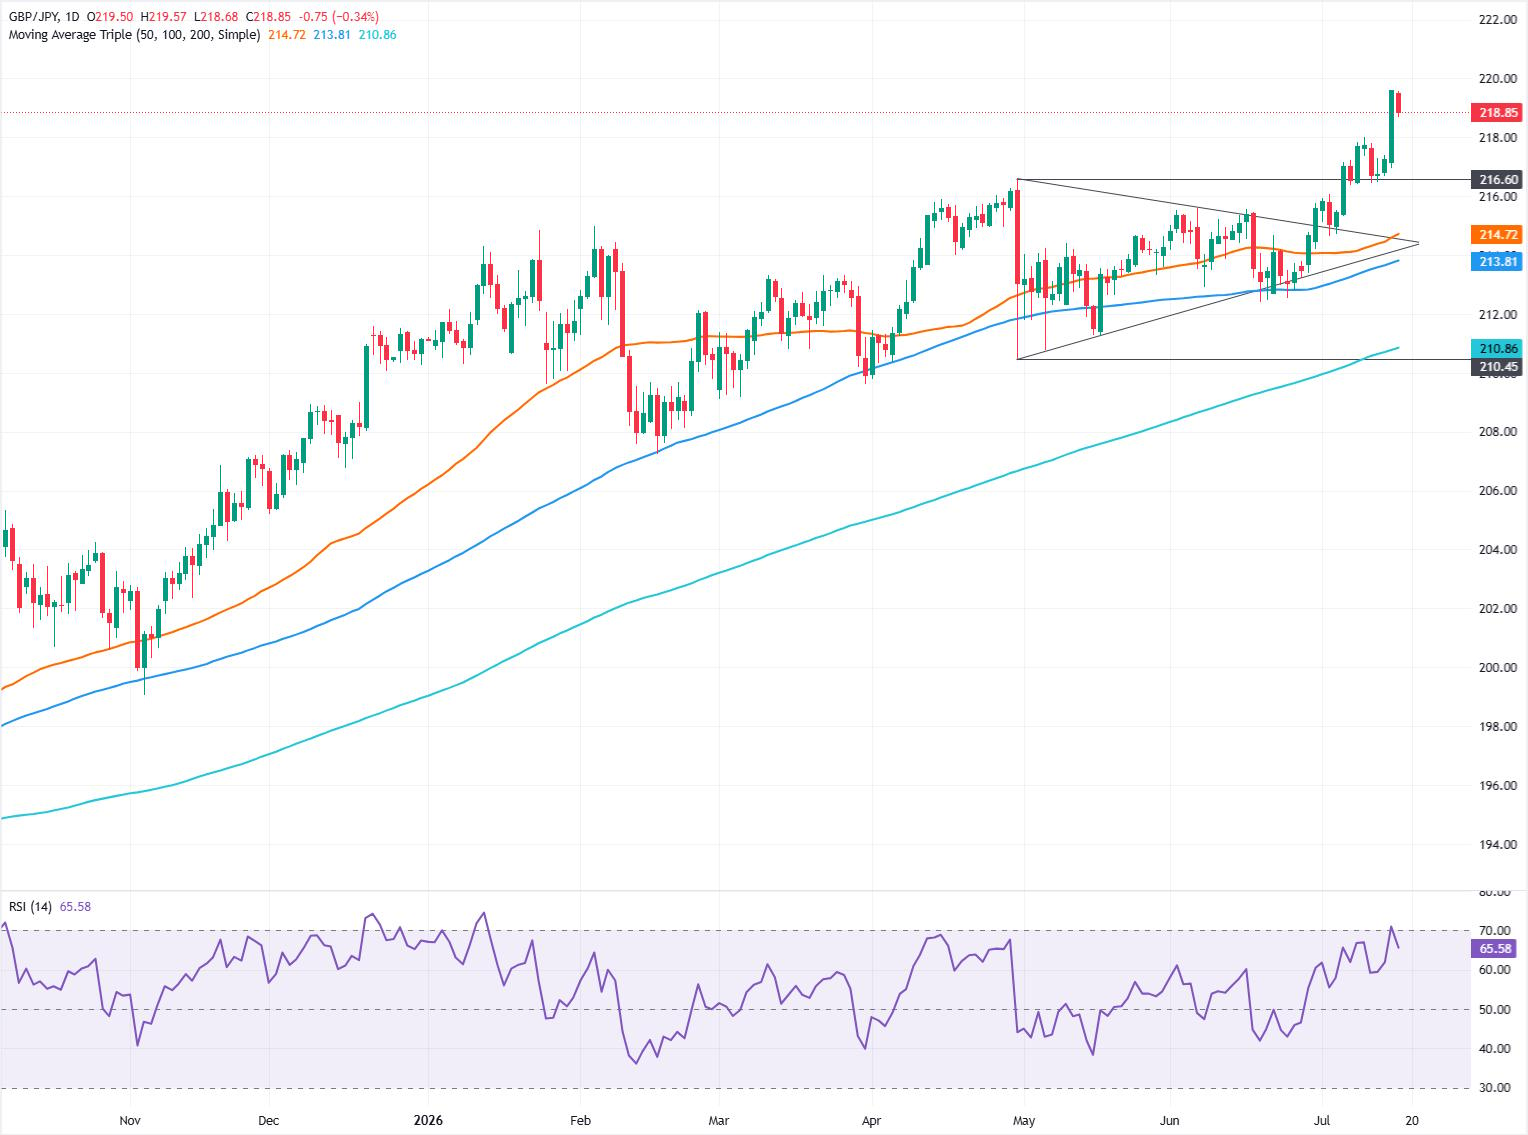
- GBP/JPY retreats from 18-year high as 220 resistance stalls rally.
- RSI remains bullish but dips, signaling short-term consolidation risk.
- Break below 218.00 exposes 216.60 and 50-day SMA support.
The GBP/JPY retreats some 0.34% on Thursday after the pair reached a new 18-year high of 219.62 on Wednesday. Nevertheless, at the time of writing, the cross-pair retreated to 218.80, down 0.34%, as the Yen recovers some ground.
GBP/JPY Price Forecast: Technical outlook
The GBP/JPY trend is up, even though it fell short of breaking 220.00, which could’ve opened the door for further gains. Momentum, as measured by the Relative Strength Index (RSI), is bullish, and as of writing, the index is dipping ahead of turning overbought. This triggered a leg down in the GBP/JPY pair, though further upside is seen.

Ahead of Friday’s Asian session, the first key resistance level is 219.00. If GBP/JPY clears that level, the 18-year high of 219.61 is up next, ahead of challenging the 22.00 mark. A decisive breach of the psychological 220.50 will expose the 221.00 level ahead.
On the other hand, if the retreat of GBP/JPY extends past 218.00, a move lower towards the April 30 high, which turned support at 216.60, is likely. If hurdled, the next area of interest would be the 216.00 figure, ahead of the 50-day Simple Moving Average (SMA) at 214.72.
GBP/JPY Price Chart — Daily
Japanese Yen Price This week
The table below shows the percentage change of Japanese Yen (JPY) against listed major currencies this week. Japanese Yen was the strongest against the Swiss Franc.
| USD | EUR | GBP | JPY | CAD | AUD | NZD | CHF | |
|---|---|---|---|---|---|---|---|---|
| USD | -0.35% | -0.67% | 0.37% | -0.80% | -0.71% | -1.27% | 0.10% | |
| EUR | 0.35% | -0.31% | 0.74% | -0.46% | -0.40% | -0.94% | 0.46% | |
| GBP | 0.67% | 0.31% | 1.01% | -0.13% | -0.09% | -0.61% | 0.82% | |
| JPY | -0.37% | -0.74% | -1.01% | -1.26% | -1.08% | -1.69% | -0.32% | |
| CAD | 0.80% | 0.46% | 0.13% | 1.26% | 0.17% | -0.46% | 0.96% | |
| AUD | 0.71% | 0.40% | 0.09% | 1.08% | -0.17% | -0.54% | 0.77% | |
| NZD | 1.27% | 0.94% | 0.61% | 1.69% | 0.46% | 0.54% | 1.46% | |
| CHF | -0.10% | -0.46% | -0.82% | 0.32% | -0.96% | -0.77% | -1.46% |
The heat map shows percentage changes of major currencies against each other. The base currency is picked from the left column, while the quote currency is picked from the top row. For example, if you pick the Japanese Yen from the left column and move along the horizontal line to the US Dollar, the percentage change displayed in the box will represent JPY (base)/USD (quote).














