


Ripple and Stellar outlook: XRP slips, XLM rebound faces resistance amid mixed sentiment
- XRP remains under pressure, trading below $1.500 on Thursday and down 1.72% so far this week.
- XLM extends its rebound, trading at $0.227 on Thursday after modest gains the previous day.
- Rising US Treasury yields and mixed derivatives metrics continue to cap upside momentum for XRP and XLM.
Ripple (XRP) remains under pressure, slipping below $1.500 on Thursday while Stellar (XLM) extends its rebound, trading around $0.227 but facing resistance amid mixed market sentiment. Rising US Treasury yields and mixed derivatives metrics continue to weigh on risk appetite, leaving traders cautious for both tokens.

Soaring US yields weigh on risky assets
Crypto markets are being held back by the same force weighing on broader risk assets: soaring US Treasury yields. The 5-year yield has risen above 5%, while the 10-year yield is above 5.2%, with both at 19-year highs. Surging yields are pushing investors away from risk assets, stalling upside momentum for Ripple and Stellar. These higher yields make traditional fixed-income assets more attractive than riskier investments such as cryptocurrencies, capping XRP and XLM’s outlook.
Mixed derivatives cap upside
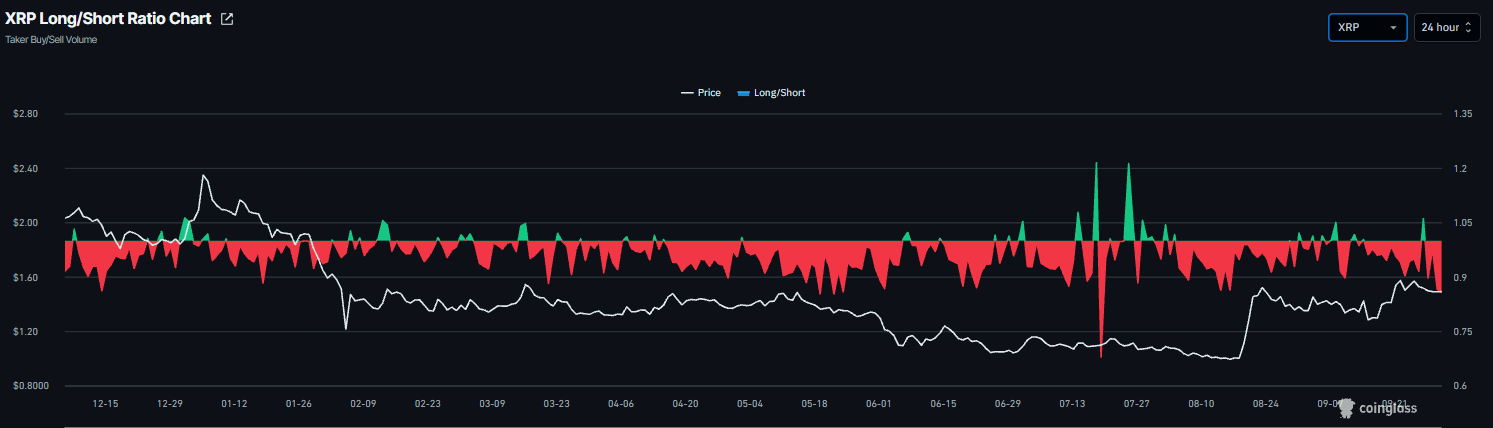
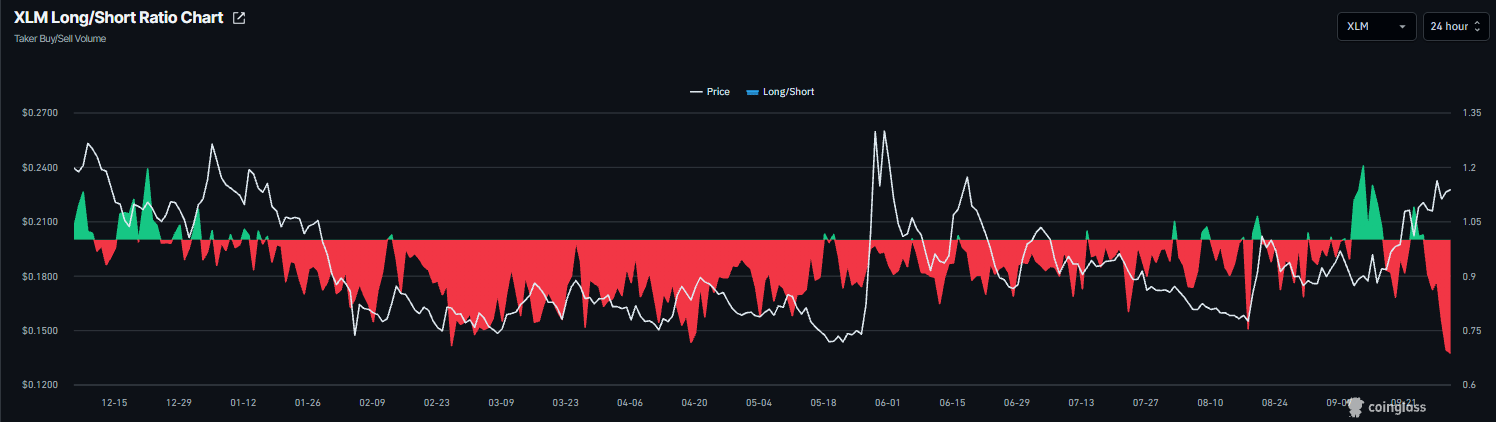
Derivatives data shows a mixed and cautious outlook among traders. CoinGlass’ long-to-short ratios for Ripple and Stellar read 0.85 and 0.68 on Thursday, nearing the lowest levels over a month. A ratio below one indicates bearish sentiment, as traders bet that asset prices will fall.
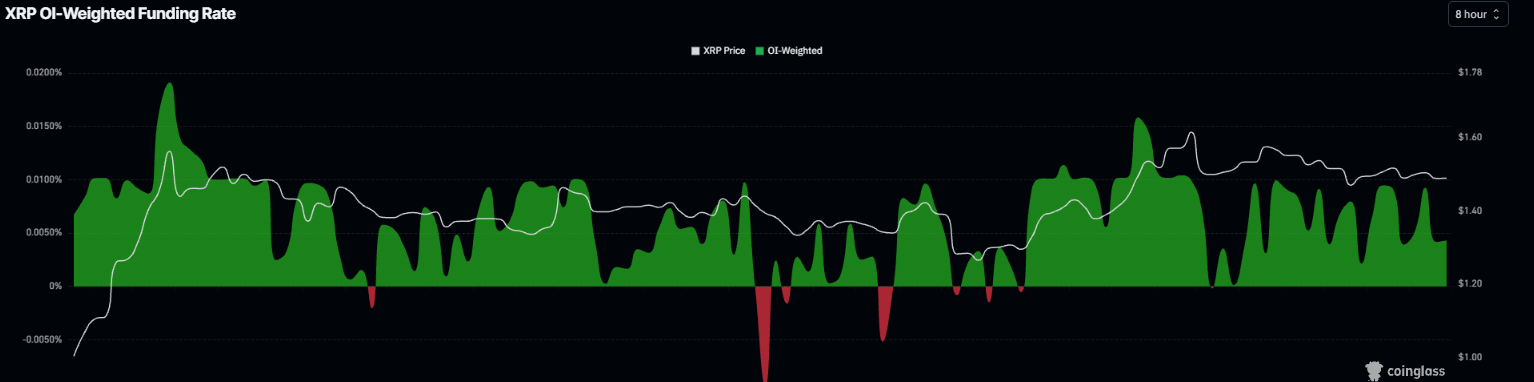
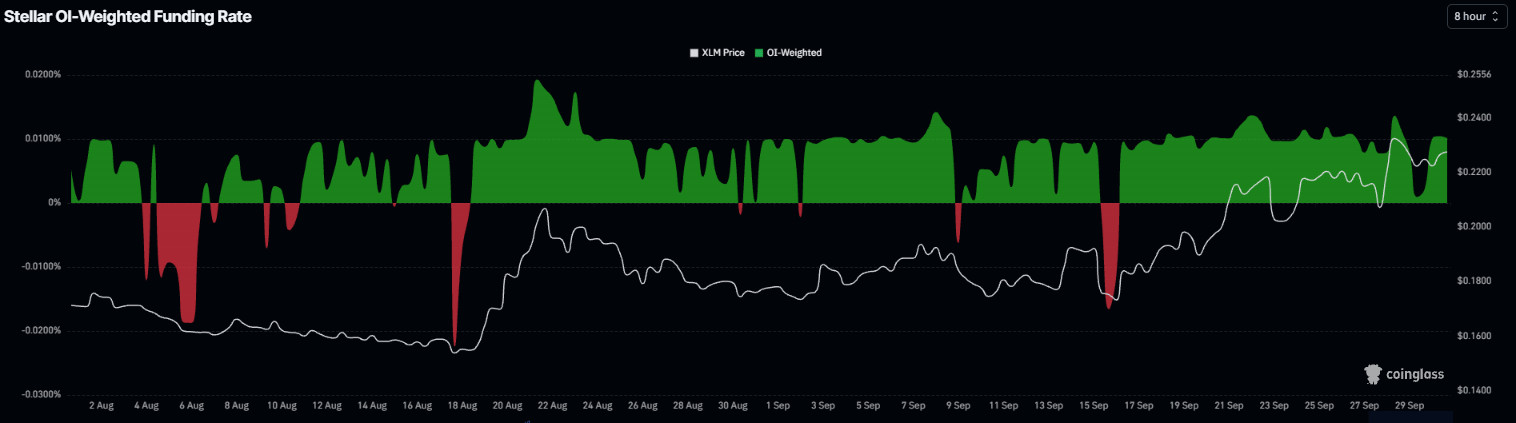
In addition, the XRP funding rate flipped positive on September 24, reading 0.0040% on Thursday. Similarly, the XLM funding rate flipped positive on September 14, reading 0.0100% on Thursday. These positive rates indicate longs are paying shorts, reflecting a bullish outlook.
XRP technical outlook: Extends pullback
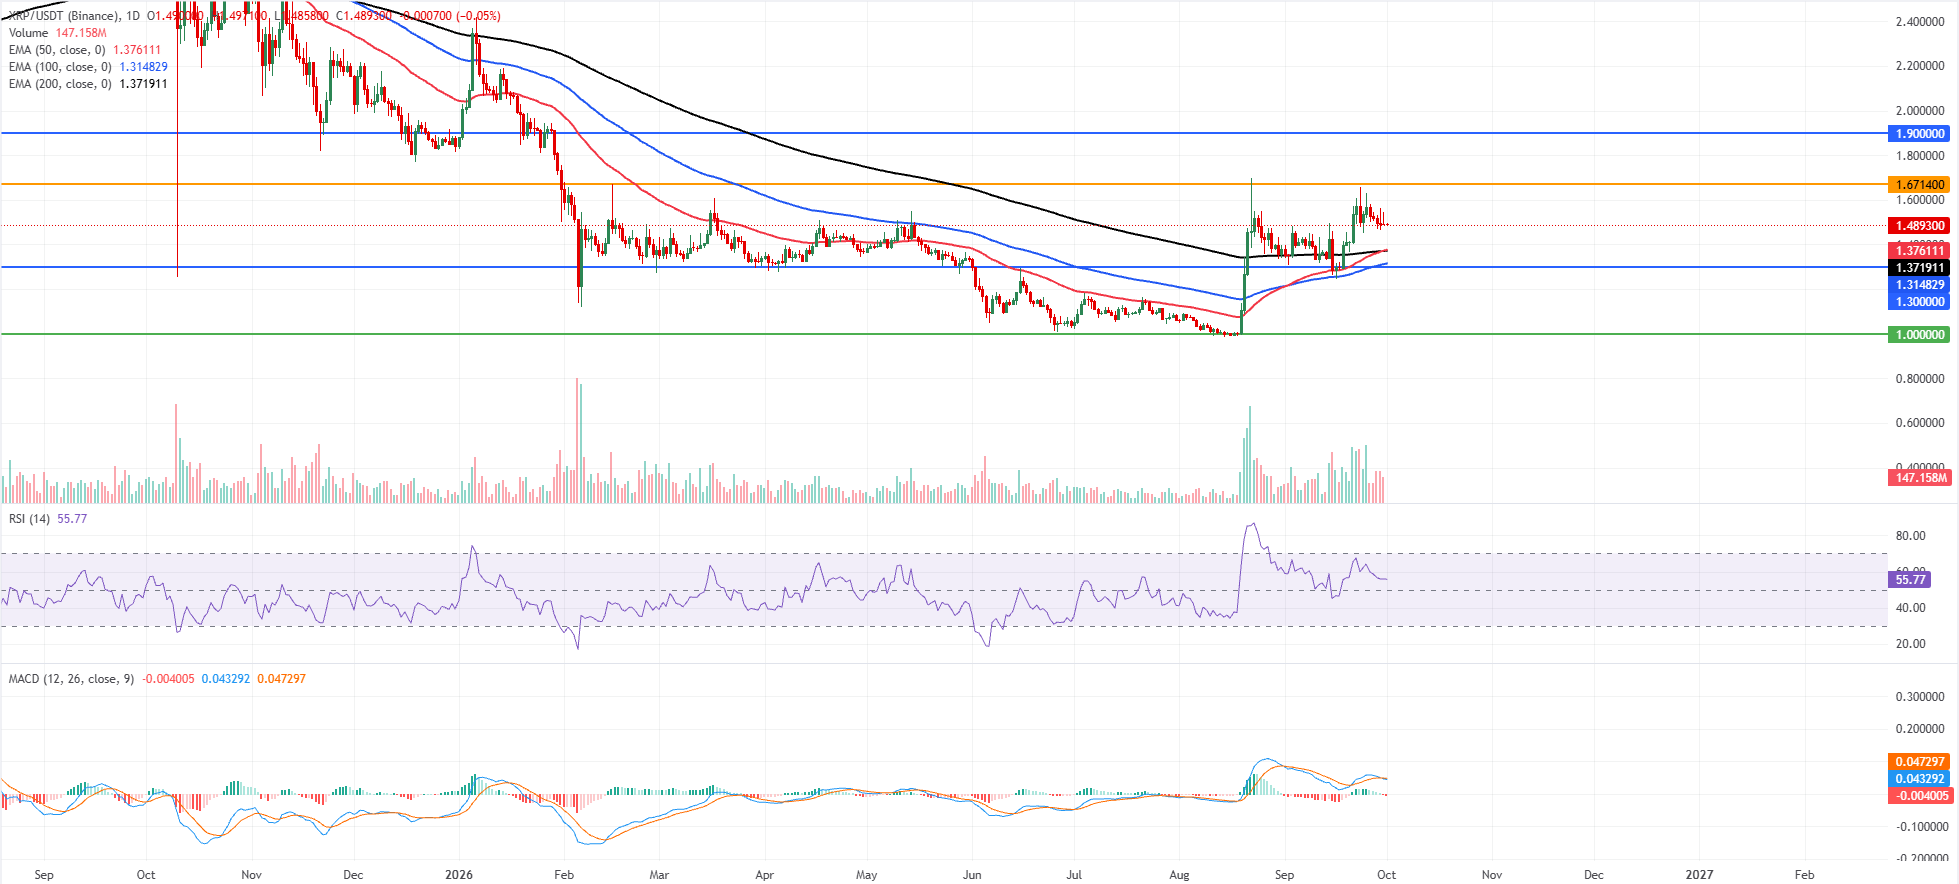
XRP price trades at $1.489 on Thursday after a slight correction so far this week. Despite this pullback, XRP remains bullish, holding well above the 50-day, 100-day, and 200-day Exponential Moving Averages (EMAs) clustered between roughly $1.376 and $1.314, which now underpin the broader uptrend.
The Relative Strength Index (RSI) at 55 stays comfortably above the neutral line, hinting at steady but not overextended buying pressure. At the same time, the Moving Average Convergence Divergence (MACD) indicator has slipped marginally below zero, suggesting that upside momentum is moderating after the recent advance rather than reversing decisively.
On the topside, initial resistance is seen at the horizontal barrier near $1.671, ahead of a stronger cap at $1.900, where fresh supply could emerge if bulls extend the rally.
On the downside, the 50-day EMA reinforces immediate support at $1.376 and the 200-day EMA at $1.371, with the 100-day EMA at $1.314 and the horizontal floor at $1.300 marking a deeper demand area; only a break below that zone would expose the more distant structural base around $1.000.
XLM technical outlook: Extends rebound
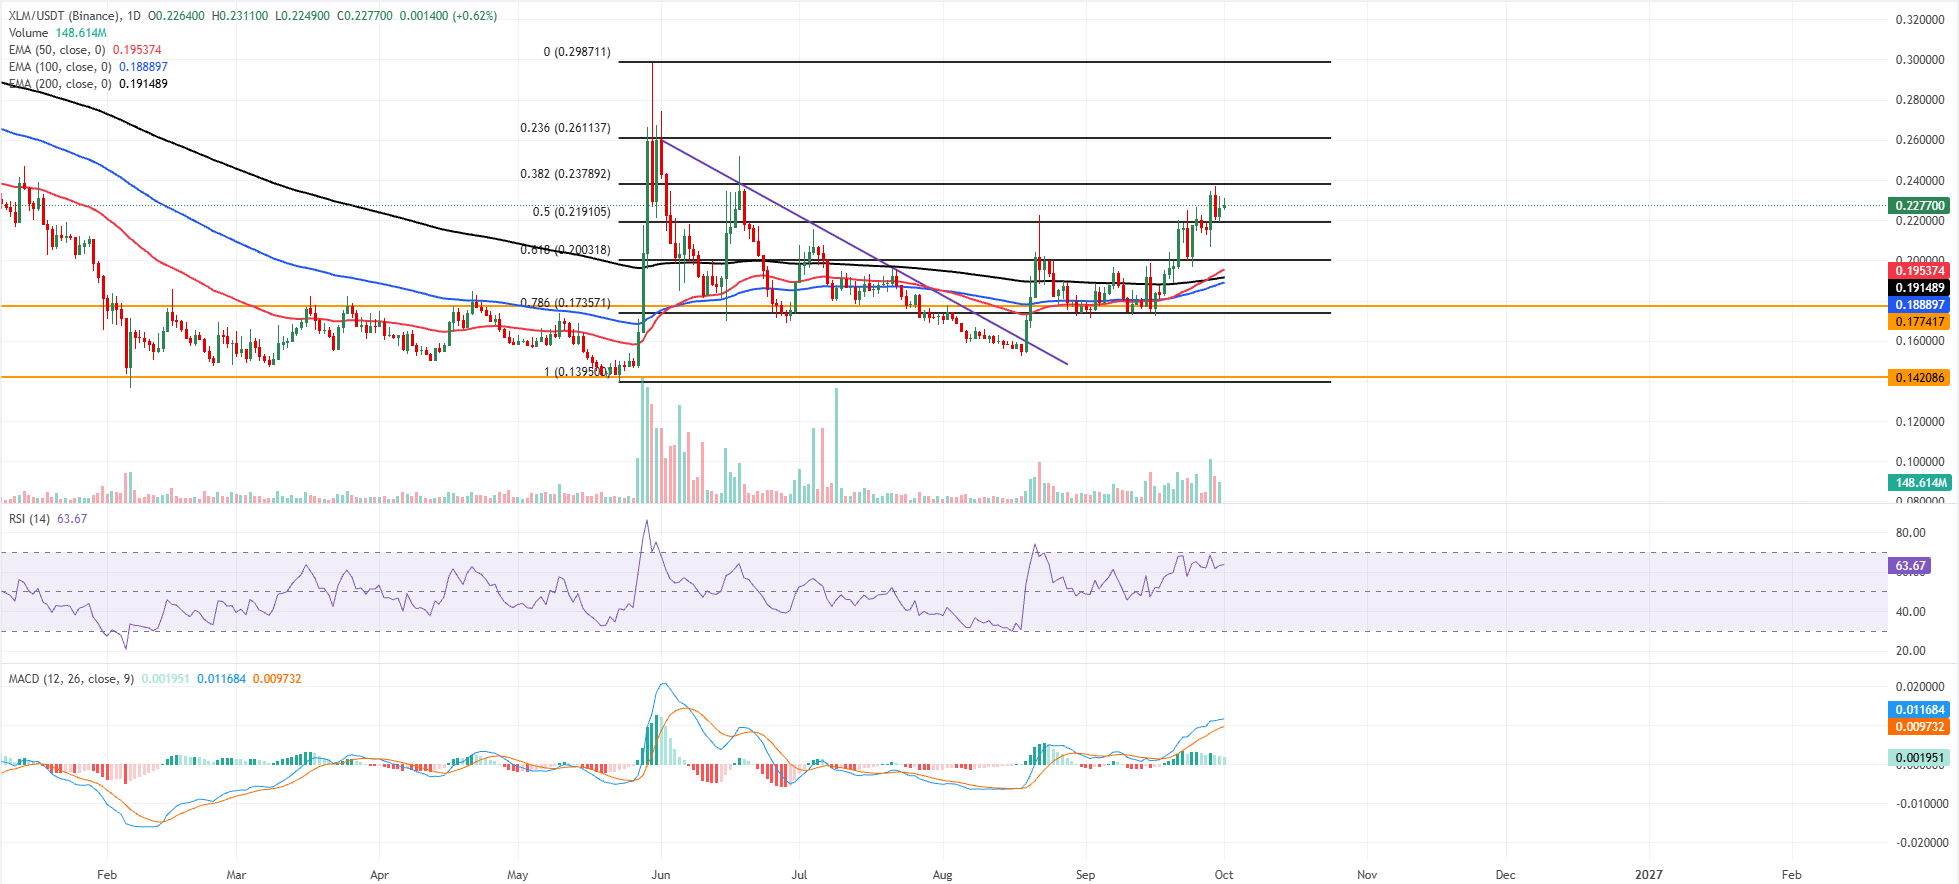
XLM price trades at $0.227 on Thursday after a slight rebound the previous day. XLM is sustaining a constructive bullish bias as price holds above the 50-day, 100-day, and 200-day EMAs clustered between roughly $0.188 and $0.195. This reclaim of the medium- and long-term EMAs, backed by a firm RSI near 63 and a positive MACD reading, suggests buyers remain in control as upside momentum builds.
On the downside, initial support aligns at the 50% retracement at $0.219, with the 61.8% Fibonacci retracement at $0.200 and the EMA cluster around $0.195–$0.191 reinforcing a broader demand zone before deeper horizontal support levels emerge at $0.177 and $0.142.
On the topside, immediate resistance is seen at the 38.2% Fibonacci retracement at $0.237, followed by the 23.6% Fibonacci retracement at $0.261 and the descending trendline resistance near $0.260, a confluence that may cap the advance unless buyers push through decisively.
(The technical analysis of this story was written with the help of an AI tool. Know more.)
인기 기사
1AUD/JPY Price Forecast: Recovers from six-month low, but retains bearish bias below 100-day SMA2Gold bulls seem hesitant as resilient US Dollar and yields cap upside3EUR/JPY Price Forecast: Tests nine-day EMA barrier after rebounding above 179.004Hyperliquid Price Forecast: HYPE pares gains as ETF outflows cap tentative bullish recovery5India Gold price today: Gold rises, according to FXStreet data6Ripple and Stellar outlook: XRP slips, XLM rebound faces resistance amid mixed sentiment7United States Dollar Index approaches yearly high near 101.80, US ISM PMI in focus8Silver Price Forecast: XAG/USD holds above $61.00 amid easing Fed rate hike expectations9Japanese Yen drops to weekly low as elevated US bond yields lift USD to two-month high
실시간 시세

TECHNICAL에 대한 모든 것

소셜 미디어












이 웹사이트에 제공된 정보는 일반적인 성격의 정보일 뿐이며 개인 맞춤형 금융 자문을 구성하지 않습니다. 이 웹사이트의 정보를 바탕으로 행동하기 전에, 귀하의 목표, 재정 상황 및 필요에 비추어 해당 정보의 적합성을 고려해야 합니다. CFD 및 FX 마진 계약에 대한 투자는 상당한 위험을 수반하며 모든 투자자에게 적합하지 않을 수 있습니다. 귀하는 최초 예치금보다 더 큰 손실을 입을 수 있습니다. 귀하는 기초자산에 대한 소유권이나 어떠한 이해관계도 보유하지 않습니다. 거래를 시작하기 전에 독립적인 자문을 구하고 관련 위험을 충분히 이해하시기를 권장합니다. 웹사이트에 기재된 상품을 취득하기 전에 공시 문서를 읽고 검토하는 것이 중요합니다. 이 웹사이트에서 제공되는 정보 및 광고는 그러한 사용이 현지 법률 및 규정에 위배되는 국가 또는 관할권의 개인이 사용하도록 의도된 것이 아닙니다. 이 웹사이트에서 제공되는 상품 및 서비스는 미국, 말레이시아 및 태국 거주자를 대상으로 하지 않습니다.
TMGM은 다양한 관할권에서 승인 및 규제를 받고 있습니다.
TMGM으로 거래하는 Trademax Australia Limited는 호주 증권투자위원회(ASIC)의 규제를 받으며, AFSL 번호 436416이고 Level 28, One International Tower, 100 Barangaroo Avenue, 2000 Sydney, NSW Australia에 위치하고 있습니다.
이메일: support@tmgm.com.au
TMGM으로 거래하는 Trademax Global Limited는 바누아투 금융서비스위원회(VFSC)의 승인 및 규제를 받으며, 등록 번호 40356이고 1276, Kumul Highway, Port Vila, Vanuatu, Republic of Vanuatu에 등록되어 있습니다.
이메일: support@tmgm.com
Trademax Global Markets (SE) Limited(이하 TMGM)는 세이셸 금융청(FSA)의 인가 및 규제를 받으며, 허가 번호는 SD224입니다. 회사는 세이셸 마헤, 프로비던스 에스테이트 ABIS 센터, 사무실 번호 13에 등록되어 있습니다.
이메일: support@tmgm.com
TMGM으로 거래하는 Trademax Global Markets (International) Pty Ltd는 모리셔스 금융서비스위원회(FSC)의 승인 및 규제를 받으며 라이선스 번호 GB22201012이고, 33, Edith Cavell Street C/o IQ EQ Fund Services (Mauritius) Ltd Port Louis, 11324 Mauritius에 등록되어 있습니다.
이메일: support@tmgm.com
Copyright © TMGM. All rights reserved