

Dogecoin Price Forecast: DOGE nears yearly low as bearish bias grows
- Dogecoin extends its losses on Friday, gravitating toward the yearly low at $0.069.
- The derivative metrics support a bearish bias, with short bets rising and funding rates turning negative.
- Deteriorating technical outlook suggests a deeper correction if DOGE slips below $0.069.
Dogecoin (DOGE) extends its decline on Friday, trading near its yearly low at $0.069 as bearish sentiment continues to weigh on the meme coin. Weakening derivatives metrics and a deteriorating technical outlook suggest a deeper correction if DOGE slips below $0.069.

Weakening derivatives metrics
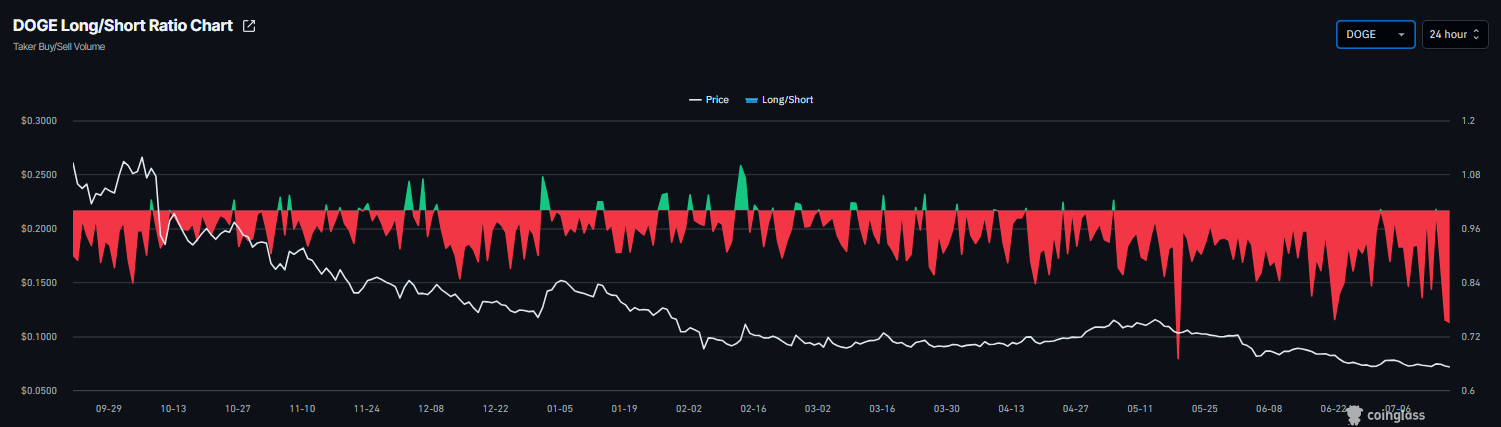
Coinglass's long-to-short ratio for DOGE read 0.75 on Friday, nearing its lowest level in over a month. The ratio being below one, indicates bearish sentiment, as traders are betting the asset's price will fall.
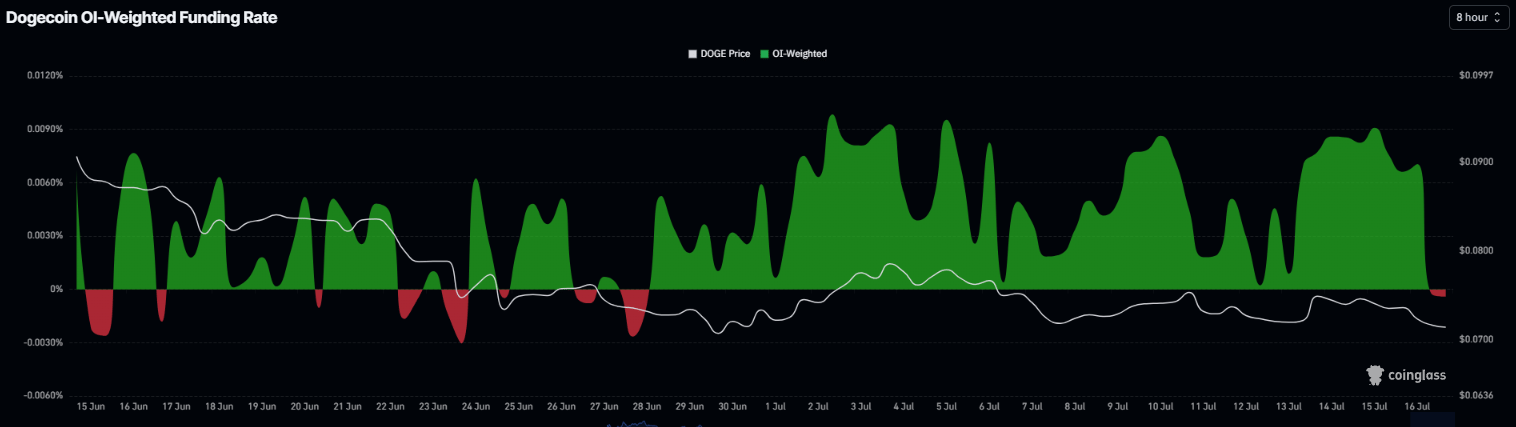
In addition, DOGE funding rates flipped negative, reading -0.0004% on Friday, further supporting the bearish sentiment.
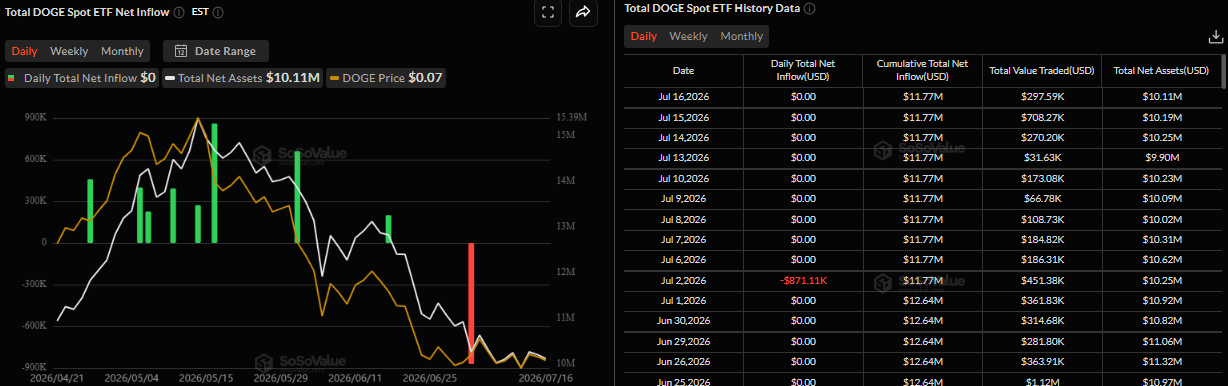
SoSoValue data show that DOGE’s spot Exchange-Traded Funds (ETFs) have remained largely silent over the past two weeks, indicating a lack of meaningful institutional demand for the token. This muted demand fails to provide a cushion against a decline in DOGE prices.
Dogecoin Price Forecast: How low can DOGE go?
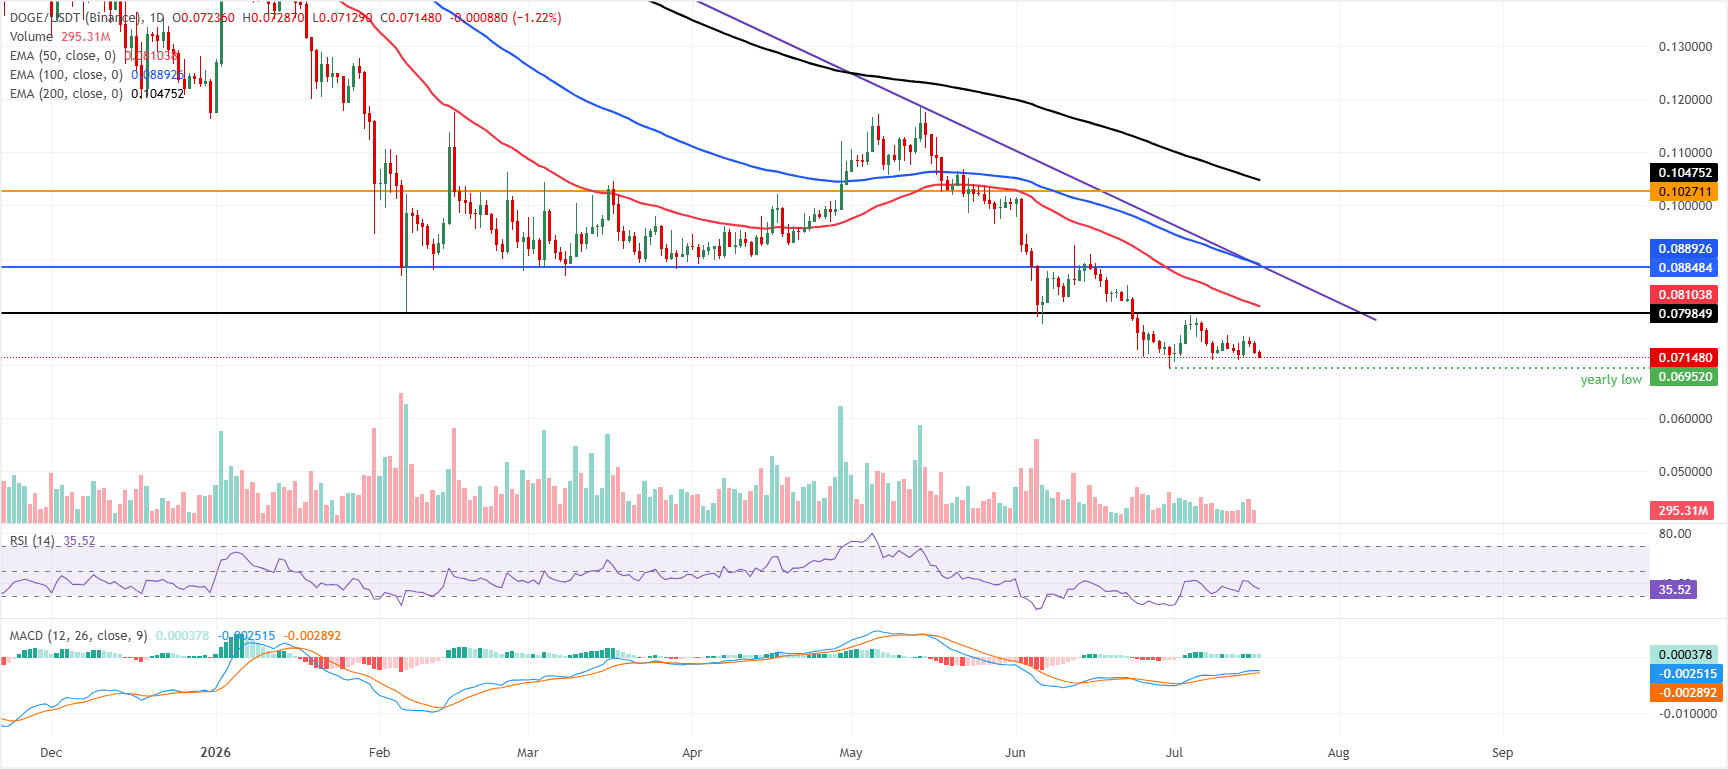
Dogecoin trades at $0.071 on Friday, keeping a clear bearish near‑term bias as price holds well below the 50‑day, 100‑day and 200‑day Exponential Moving Averages (EMAs) at $0.081, $0.088 and $0.104, respectively. The cluster of overhead EMAs suggests rallies are likely to be capped. At the same time, the Relative Strength Index (RSI) near 35 remains weak but shy of oversold territory, and the Moving Average Convergence Divergence (MACD) indicator stays marginally positive around the zero line, hinting at only modest downside momentum rather than an impulsive sell‑off.
On the topside, initial resistance is seen at the horizontal barrier at $0.079, followed by the 50‑day EMA at $0.081. Above that, a dense supply zone emerges around $0.088, defined by horizontal resistance at $0.088, the downtrend resistance line break price at $0.089.
On the downside, the yearly low at $0.069 provides immediate support; a close below it suggests deeper losses toward the key psychological level of $0.065.
(The technical analysis of this story was written with the help of an AI tool. Know more.)














