

Pi Network Price Forecast: Mild recovery in PI marks early signs of trend reversal
- Pi Network edges higher on Friday, holding above its crucial support trendline near $0.7500.
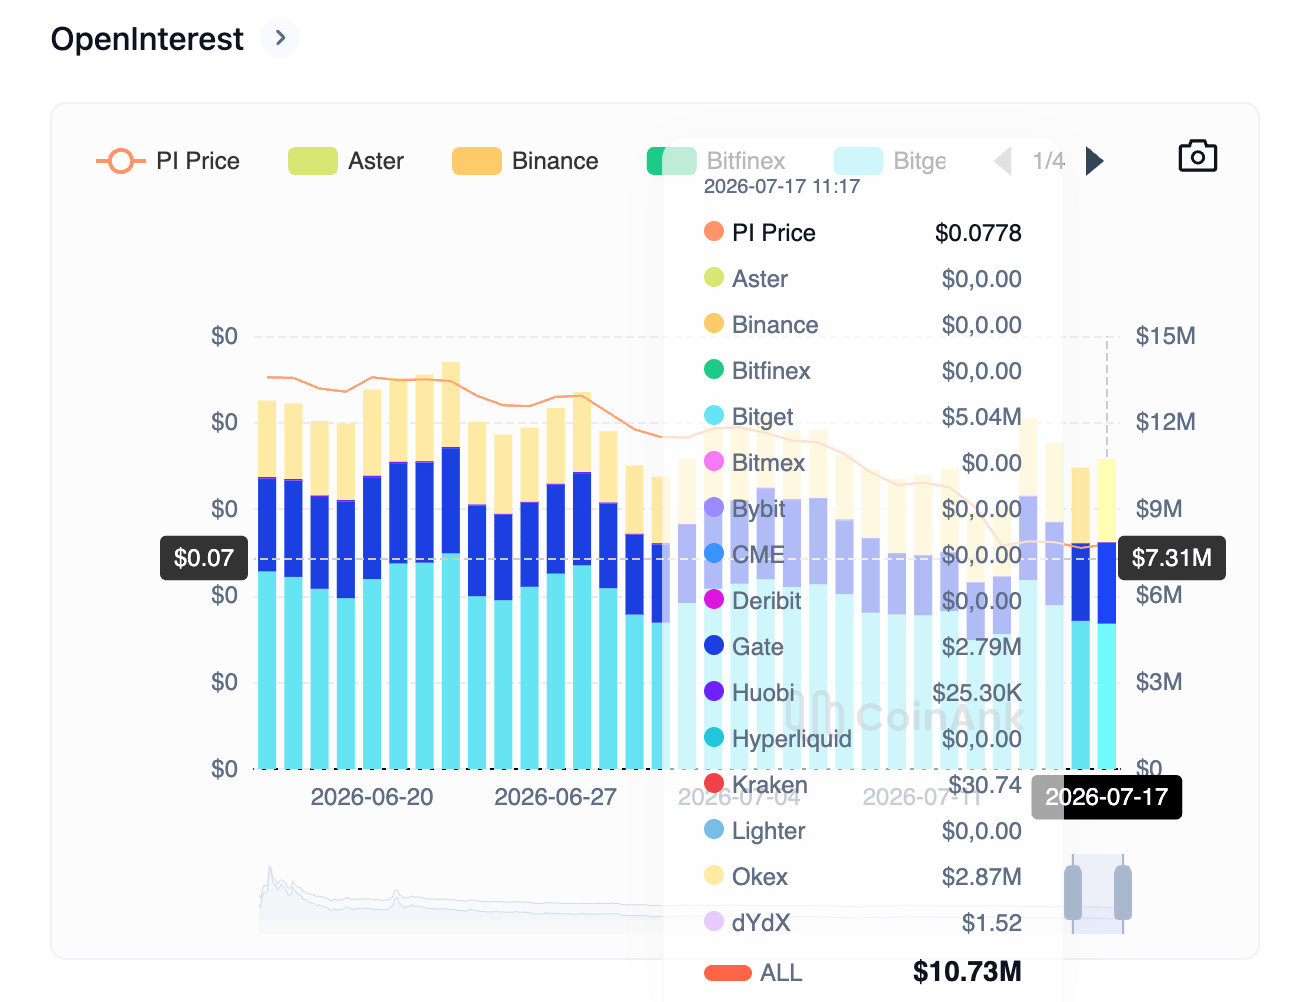
- Retail speculation builds as PI Open Interest rises to $10.73 million, from $10.44 million the previous day.
- The technical outlook for PI indicates a potential rebound, with price holding steady while oversold momentum continues to drag.
Pi Network (PI) shows a mild recovery on Friday, following three consecutive days of consolidation, as selling pressure eases after a steep decline earlier this month. Speculative demand for a potential rebound in PI is on the rise as its Open Interest remains elevated. Technically, PI holding steady at key support amid oversold momentum implies a potential recovery ahead.

Retail demand builds as price holds
Pi Network remains a highly speculative, community-driven crypto asset that saw a sharp correction earlier this month as broader market sentiment shifted to risk-off. However, the upcoming mainnet upgrade to Stellar Protocol version 25 on July 22, alongside easing market-wide risk-off sentiment, implies improving bullish factors for PI.
Early signs of building speculative demand are emerging, with CoinAnk data showing PI Open Interest rose to $10.73 million on Friday, up from $10.44 million the previous day. This post-dip buildup to $9.11 million on Monday reaffirms a positive shift in retail sentiment.
Will PI take a bullish reversal?
Pi Network maintains a bearish tone below $0.08000, as price holds near the descending support trendline of a falling channel. In addition, the 161.8% Fibonacci extension level at $0.06793, measured from $0.1998 to $0.1183, reinforces the support trendline.
The Moving Average Convergence Divergence (MACD) sits in negative territory below zero as the bearish profile weakens, while the Relative Strength Index (RSI) around 17 signals oversold conditions, hinting that the latest slide is stretched but not yet decisively reversing.
On the topside, initial resistance emerges at the 127.2% Fibonacci extension at $0.09613, with a more substantial barrier at the overhead trendline near $0.110, where any recovery would likely stall unless broader sentiment improves.
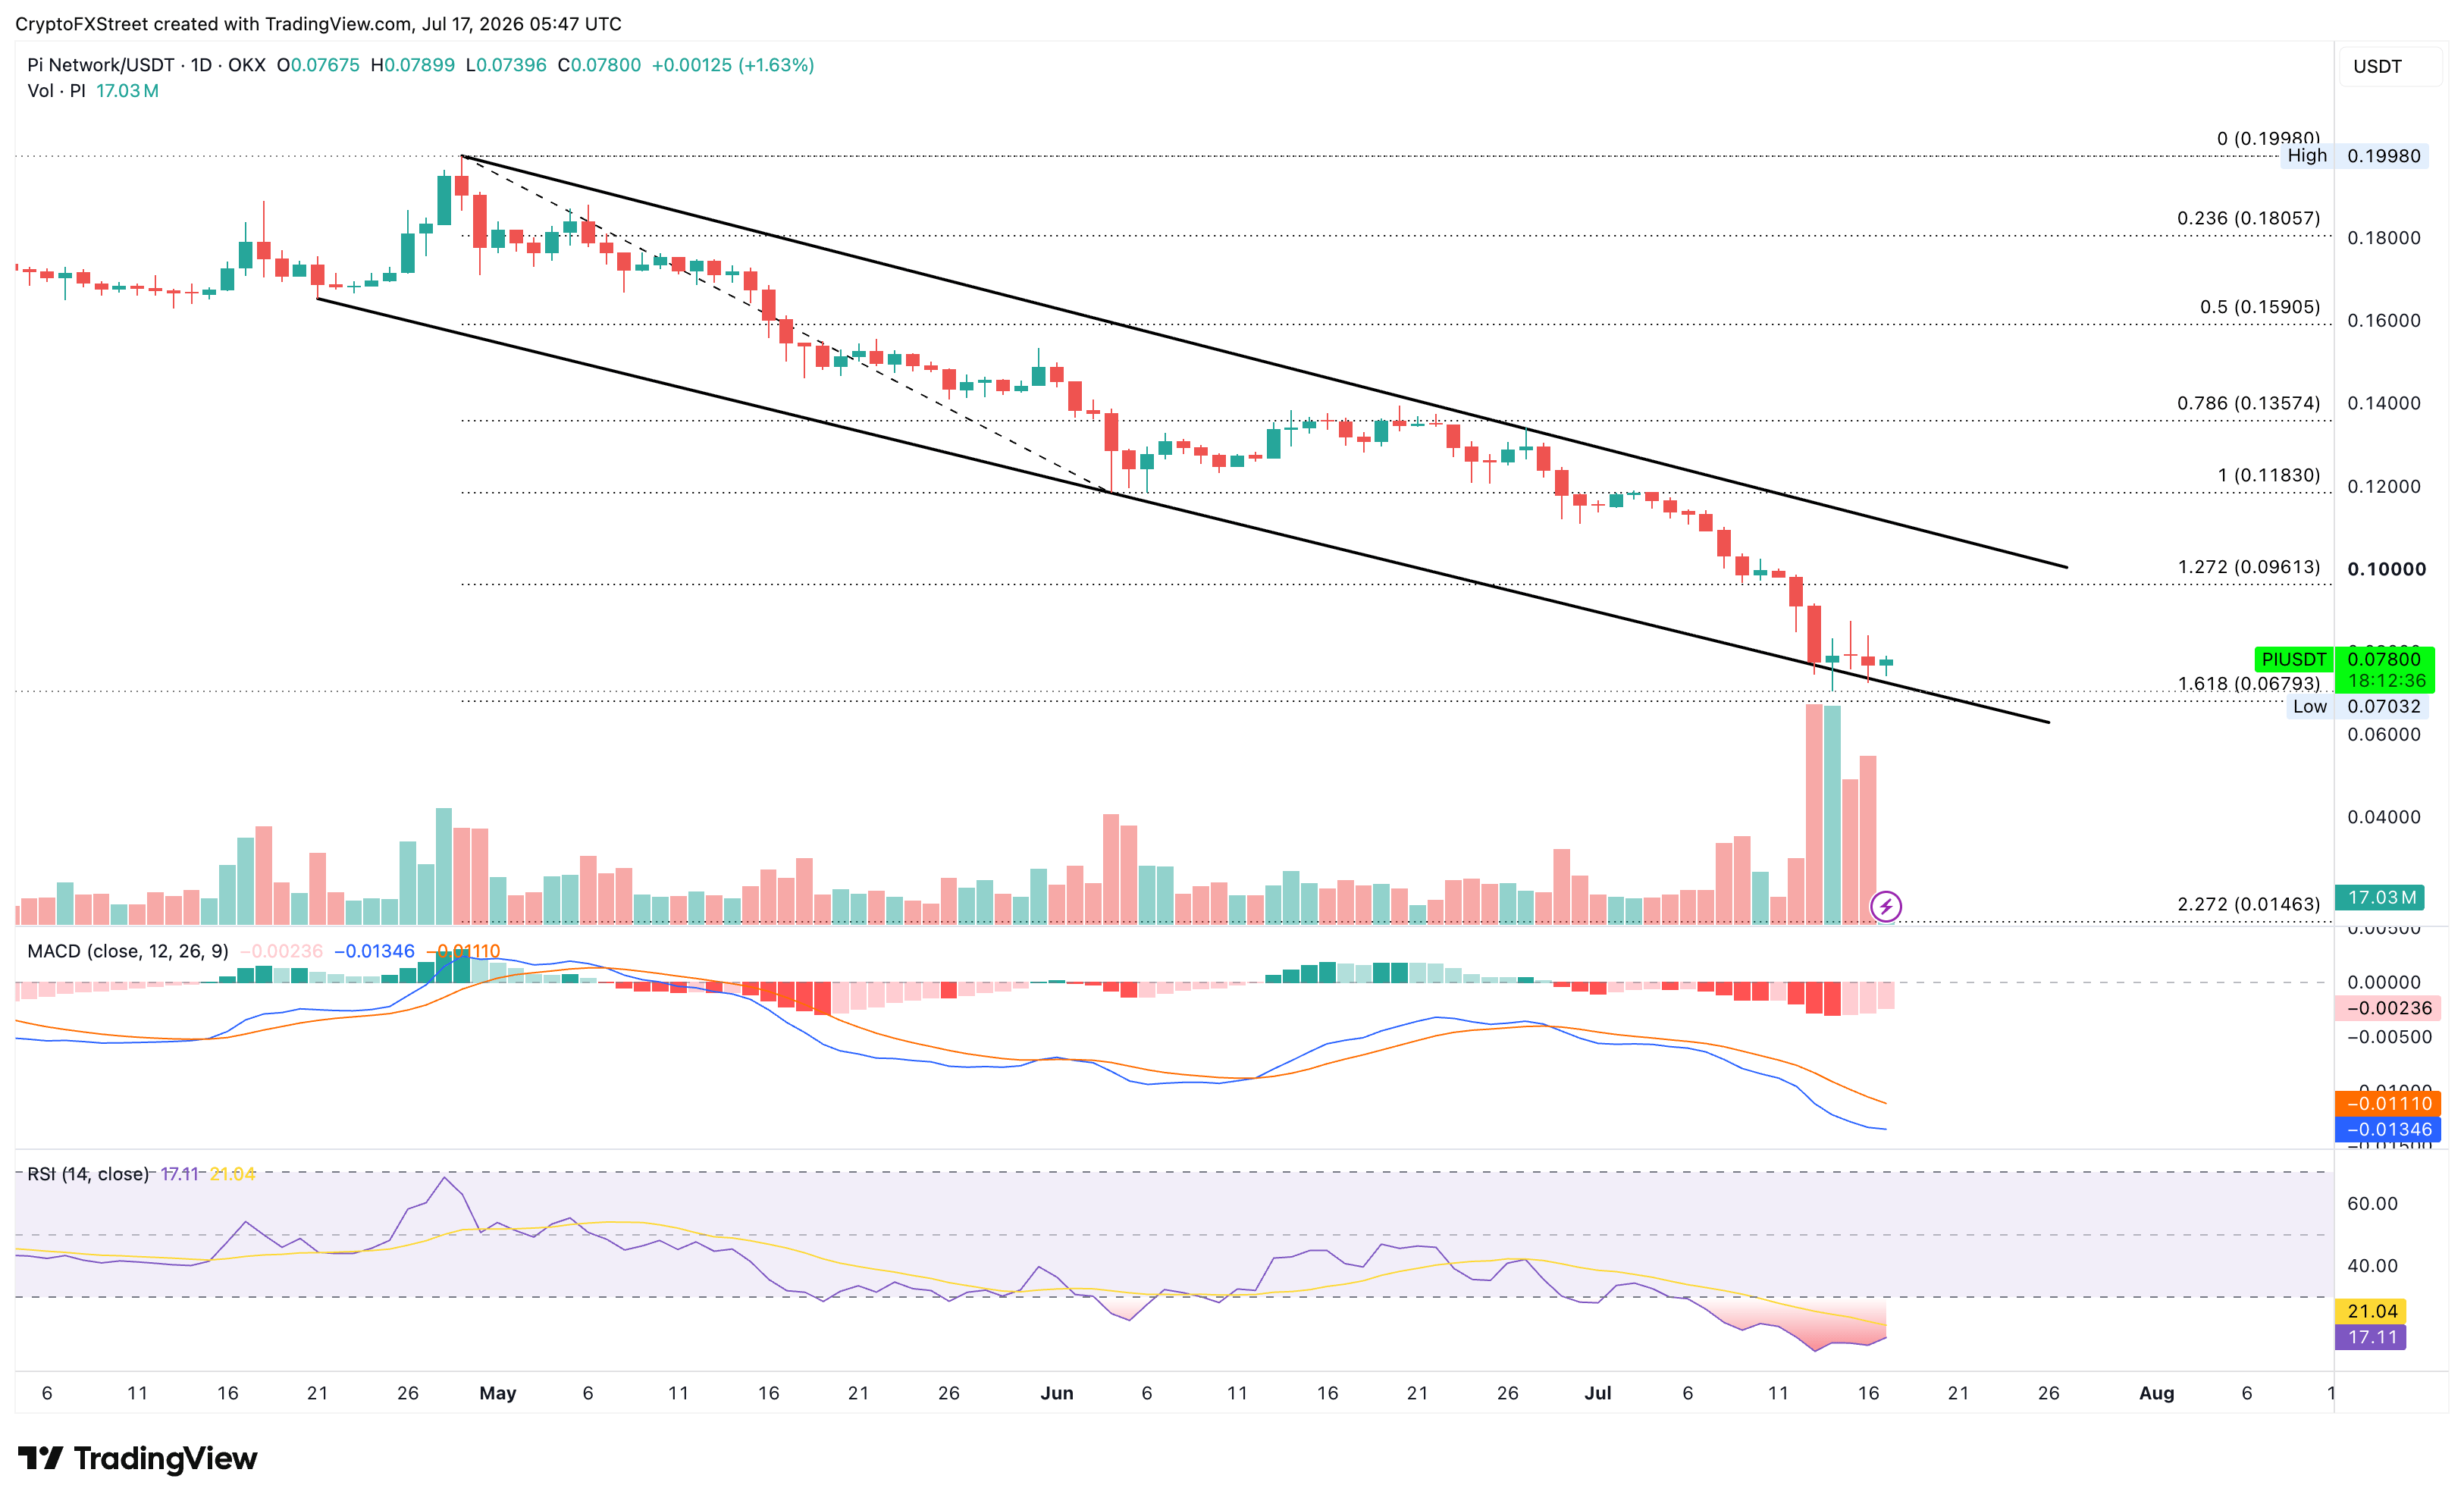
On the downside, the 161.8% Fibonacci extension level at $0.06793 remains the last line of defense, guarding the downside to the 227.2% Fibonacci extension at $0.01463.
(The technical analysis of this story was written with the help of an AI tool. Know more.)














