

Pi Network Price Forecast: PI crashes to a record low amid broader market stress
- Pi Network is down 4% on Wednesday, marking its fifth consecutive day of losses.
- Bearish sentiment tightens its grip on retail participation as Open Interest and funding rates decline.
- The technical outlook is bearish, with selling pressure building despite oversold signals.
Pi Network (PI) price edges toward $0.1000 at press time on Wednesday, extending losses for the fifth straight day. Retail sentiment remains bearish as Open Interest and the funding rate decline. The technical outlook for PI is bearish as selling pressure mounts, despite oversold conditions.

Retail interest in PI leans bearish
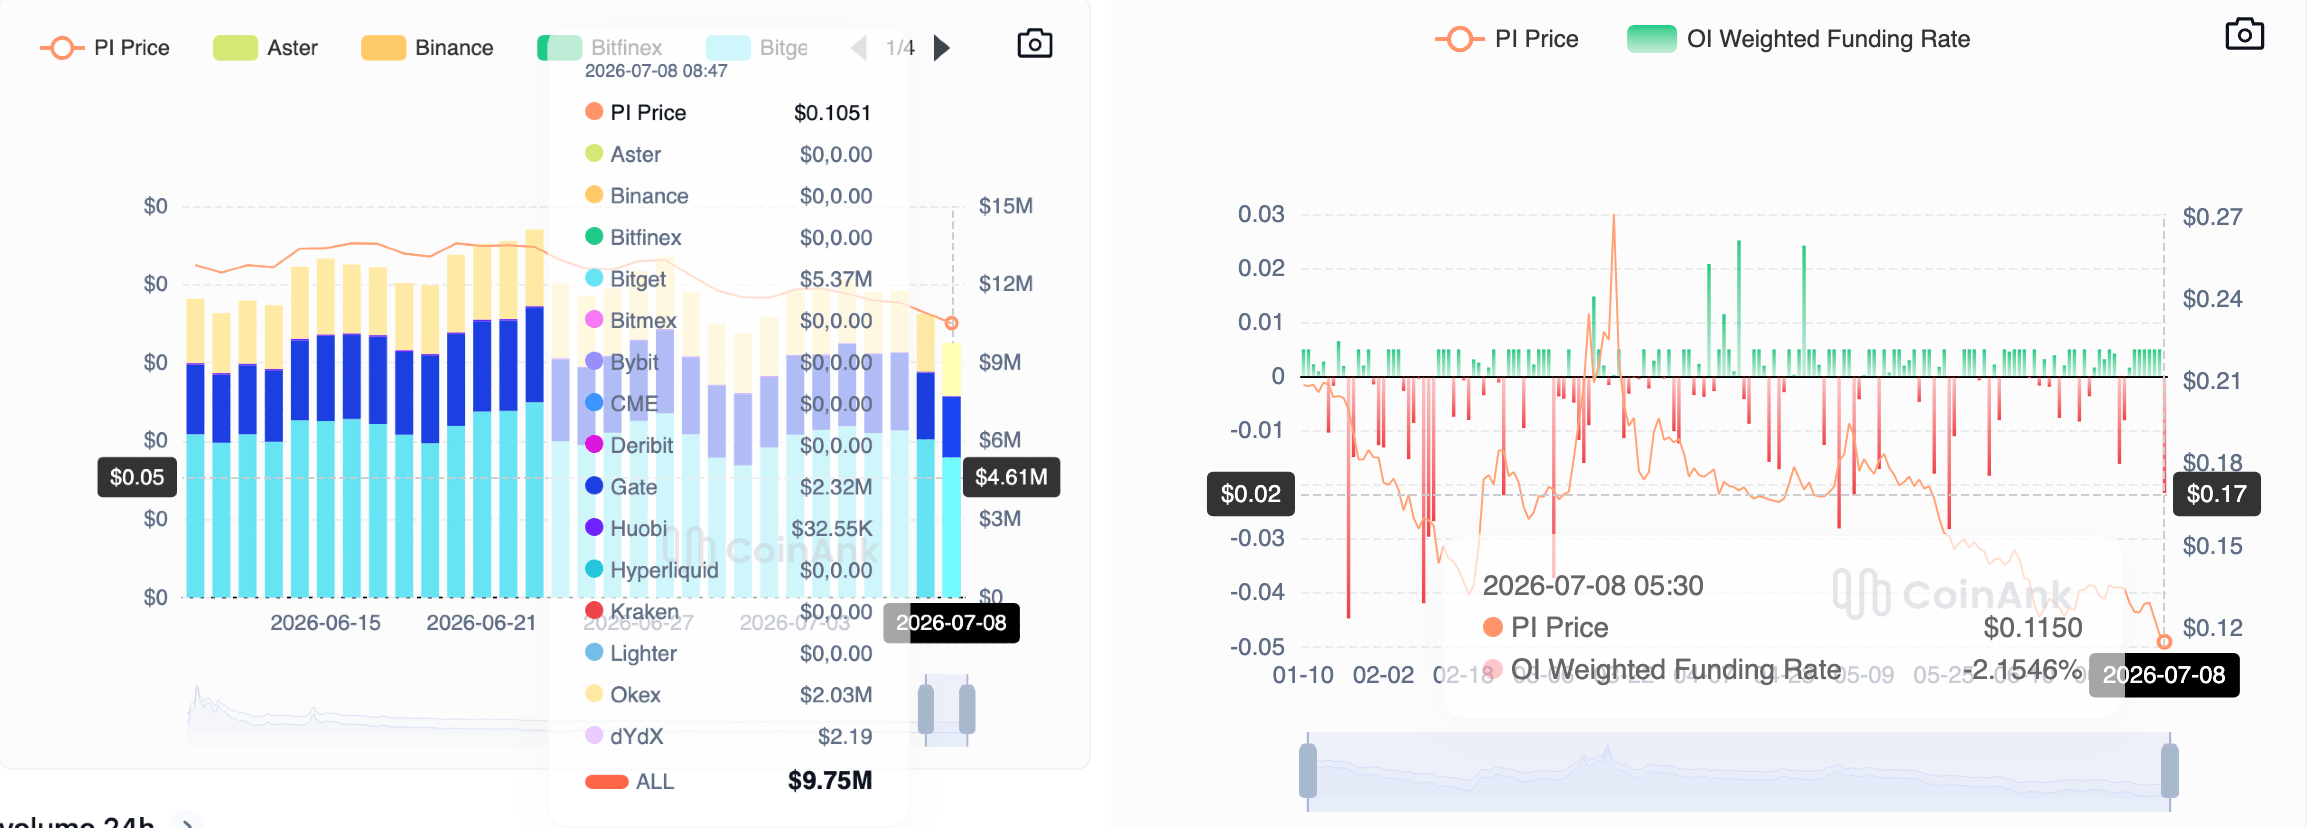
Pi Network is losing its retail strength as the broader market sentiment remains mixed amid the resurfacing tensions between the US and Iran. CoinAnk data shows the PI Open Interest has dropped to $9.75 million on Wednesday from $10.88 million the previous day, signaling a positional wipeout. At the same time, the funding rate has dropped to -2.1546%, indicating a clear bearish bias among traders holding short positions.
How low will Pi Network go?
Pi Network extends its slide toward $0.1000 at press time on Wednesday, with its fifth consecutive day of losses. From a technical perspective, PI is moving closer to the S1 Pivot Point at $0.1010, a key support level where buyers could attempt to regain control. However, a slip below this level could extend the decline below the $0.1000 psychological threshold, potentially targeting the S2 Pivot Point at $0.0867.
Momentum conditions remain weak, with the Relative Strength Index (RSI) in oversold territory near 23 and the Moving Average Convergence Divergence (MACD) descending below its signal line in negative territory, hinting at persistent downside pressure despite intermittent corrective bounces.
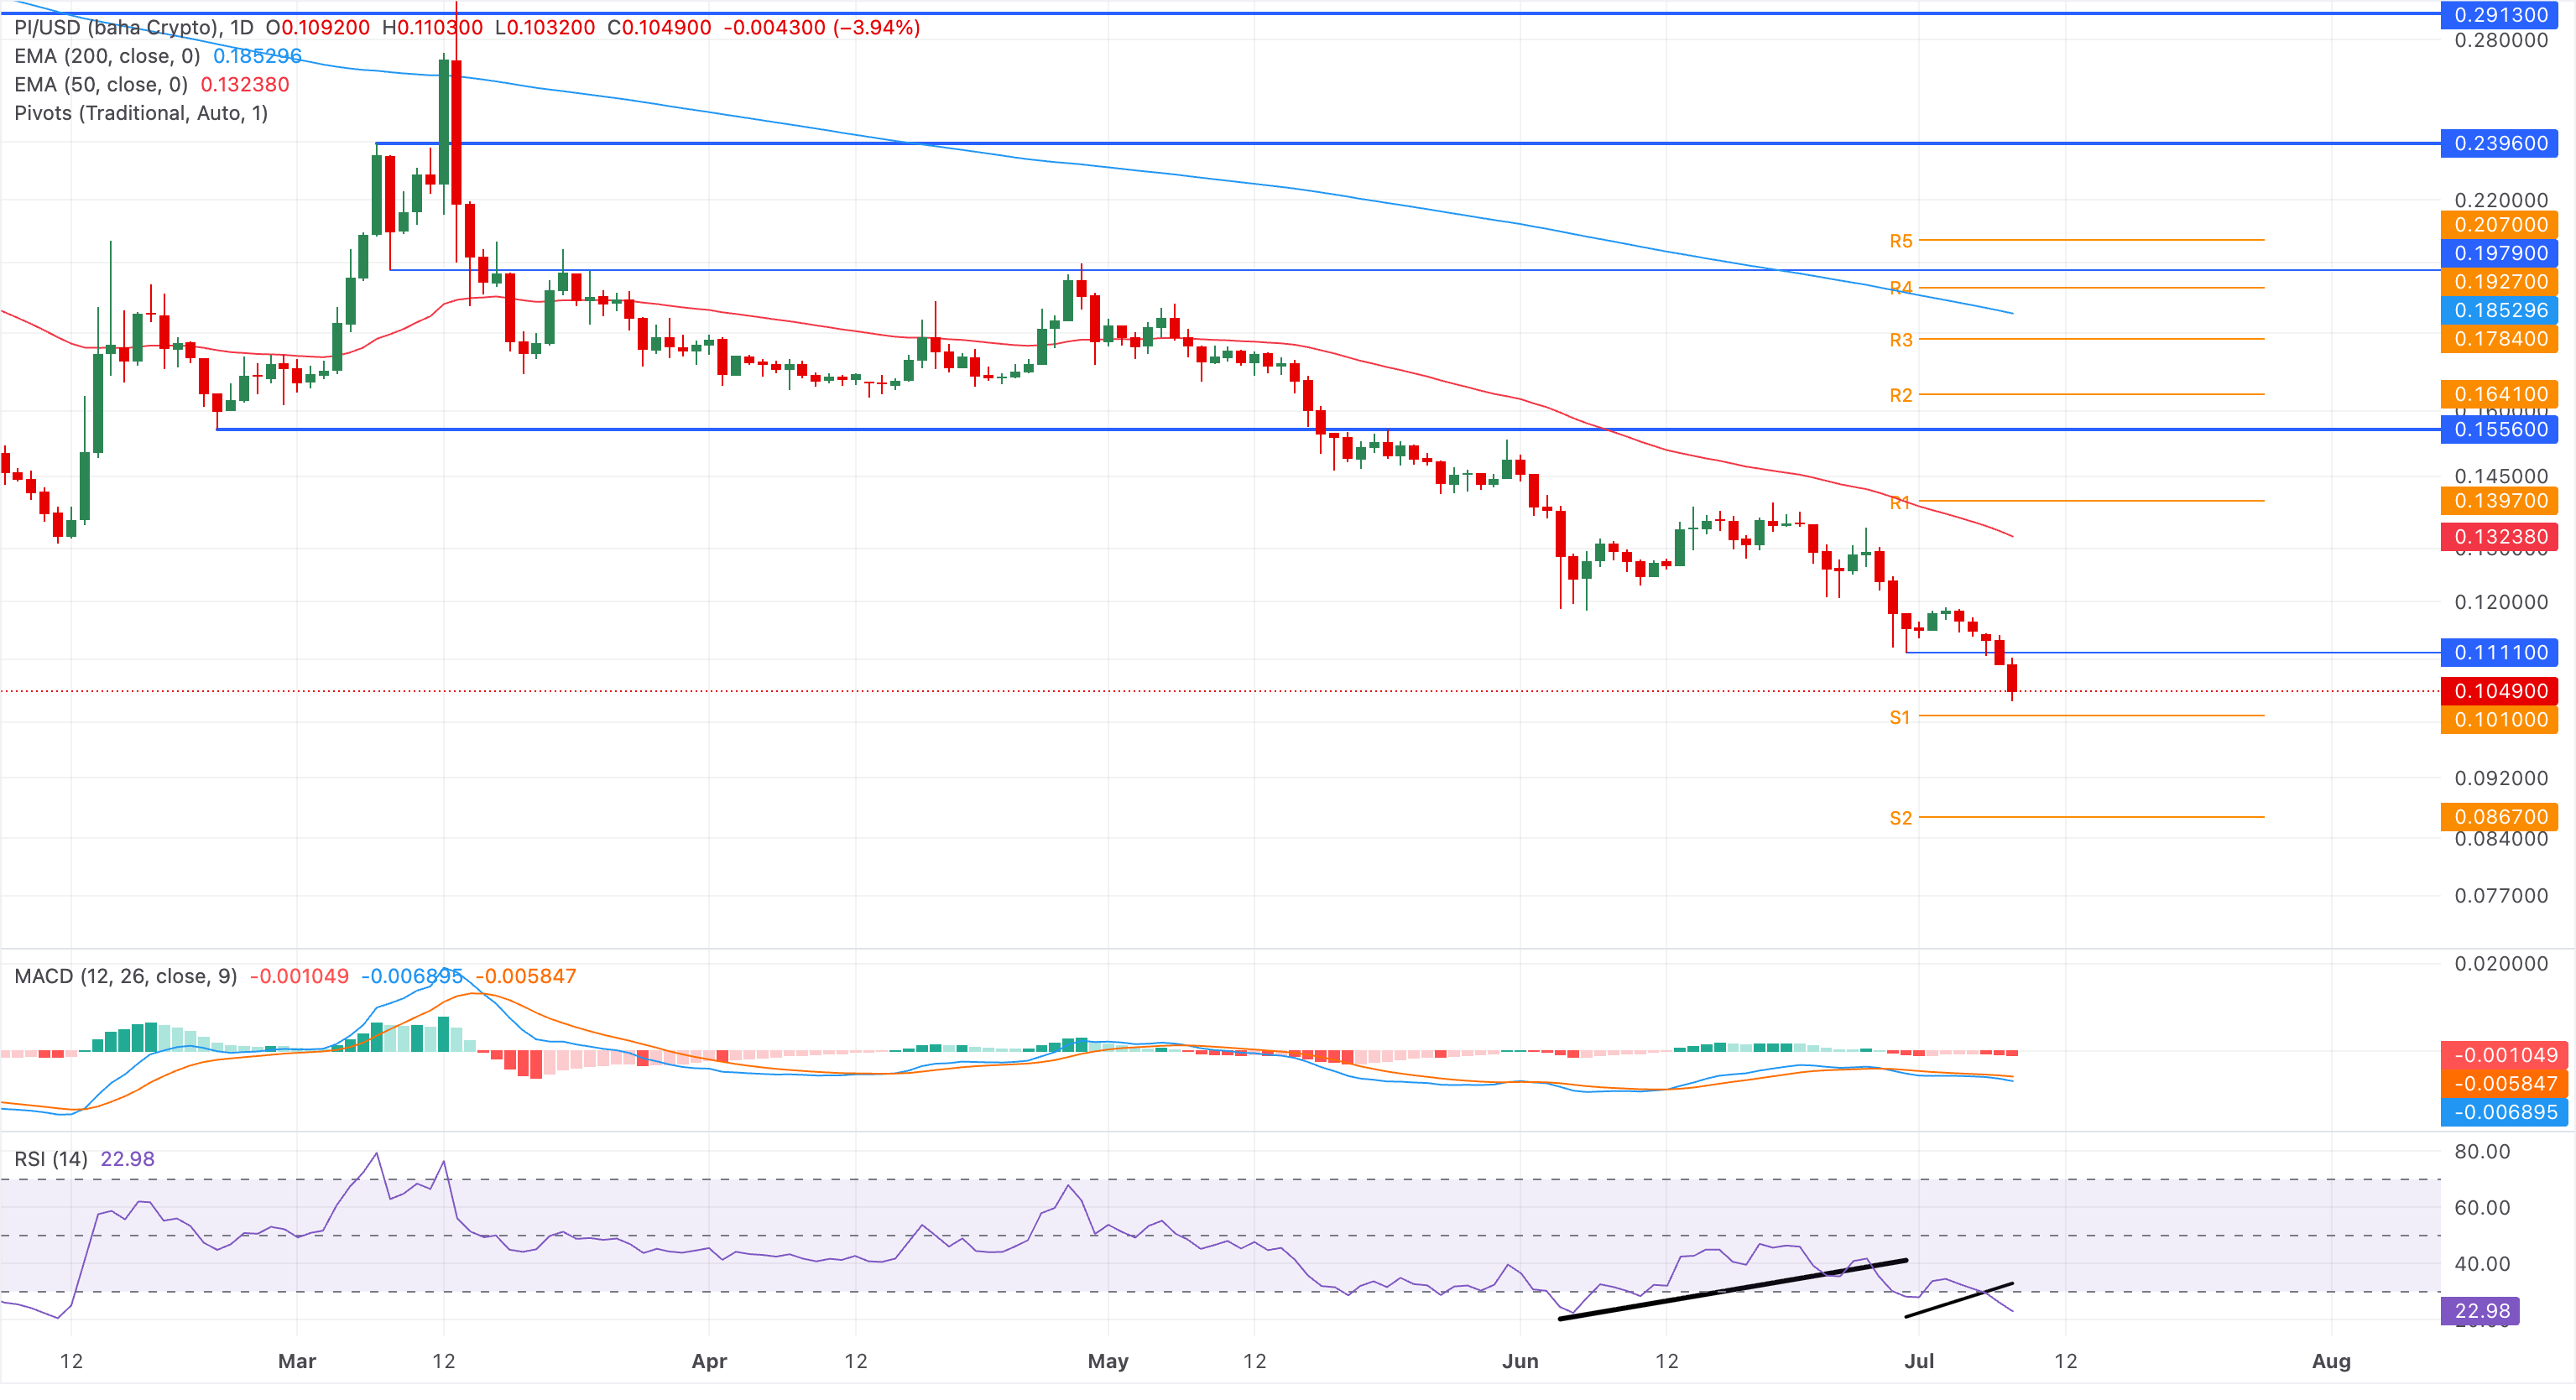
On the topside, initial resistance emerges at the 50-day EMA around $0.1324, with a subsequent barrier at the R1 Pivot Point at $0.1397.
(The technical analysis of this story was written with the help of an AI tool. Know more.)














