

Tron Price Forecast: TRX climbs to its highest level in 1.5 years
- Tron price extends its gains on Tuesday, reaching the highest level since December 6, 2024.
- Tron Inc. added 136,998 TRX tokens on Monday, lifting its total treasury holdings to over 697.5 million TRX.
- Derivatives data supports bullish bias with rising open interest and positive funding rates signaling growing trader confidence.
Tron (TRX) price is extending its rally, trading above $0.370 on Tuesday and reaching its highest level in 1.5 years. This bullish rally is further strengthened as Tron Inc. (TRON) added another 136,998 TRX tokens to its reserve. In addition, rising open interest and positive funding rates in the derivatives market further support TRX’s positive outlook.

Tron Inc. buys TRX tokens
Tron Inc. announced in its X post that the firm acquired 136,998 TRX tokens on Monday, bringing the total reserve to 697.5 million TRX.
“The company aims to further grow its Tron Digital Asset Treasury (DAT) holdings to enhance long-term shareholder value,” said TRON in its X post.
If these accumulations continue and grow, they could support the native token TRX in the long term by enhancing adoption and reducing circulating supply, thereby increasing its price.
Derivatives metrics support the price surge
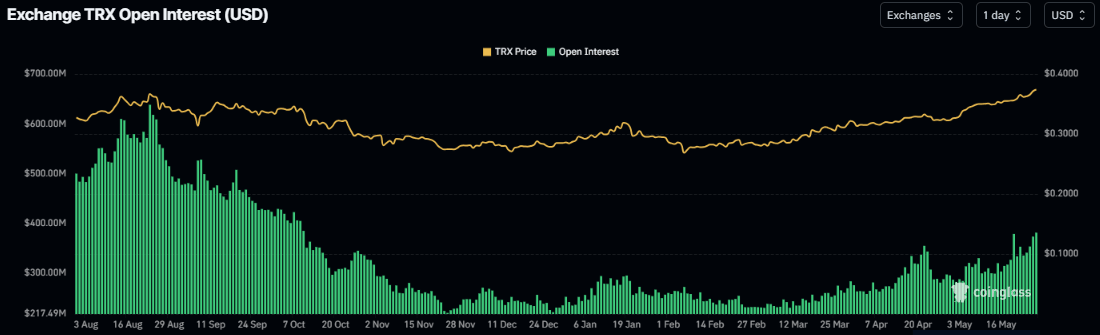
Tron derivatives data supports its ongoing price rally. CoinGlass data shows that the futures’ Open Interest (OI) on TRX exchanges reached a record high of $381 million on Tuesday, the highest level since mid October 2025, and has been steadily rising since early May. An increase in OI indicates new or additional money entering the market and new buying, which could fuel a rally in TRX’s price.
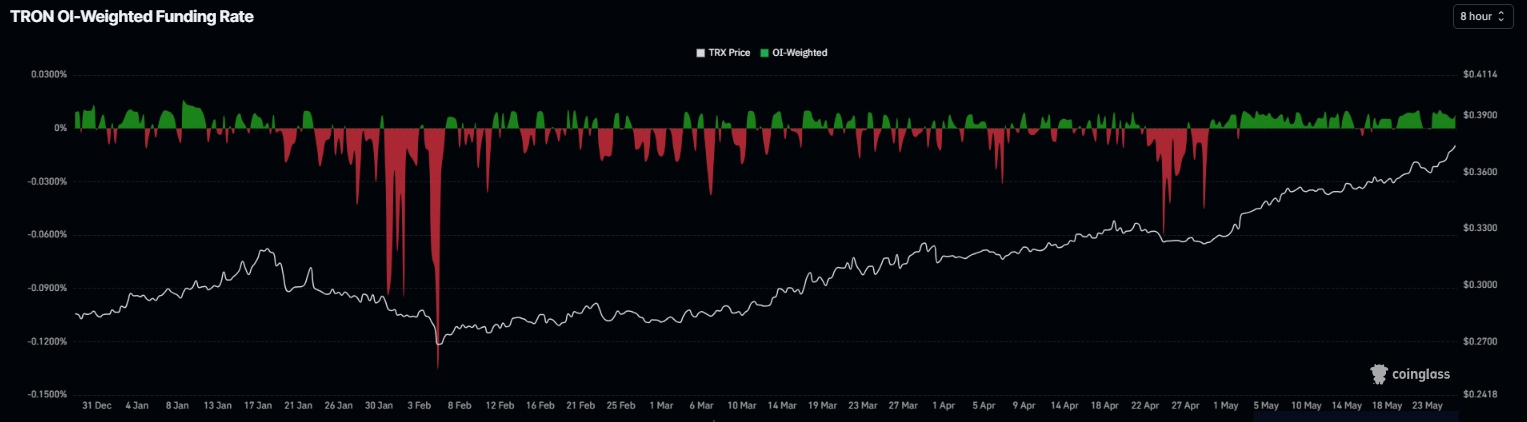
In addition, the funding rates also project a positive outlook. TRX funding rates turned positive on Saturday and surge to 0.0079% on Tuesday. These positive rates indicate that longs are paying shorts and projecting a bullish sentiment.
Tron Price Forecast: Surges to a 1.5-year high
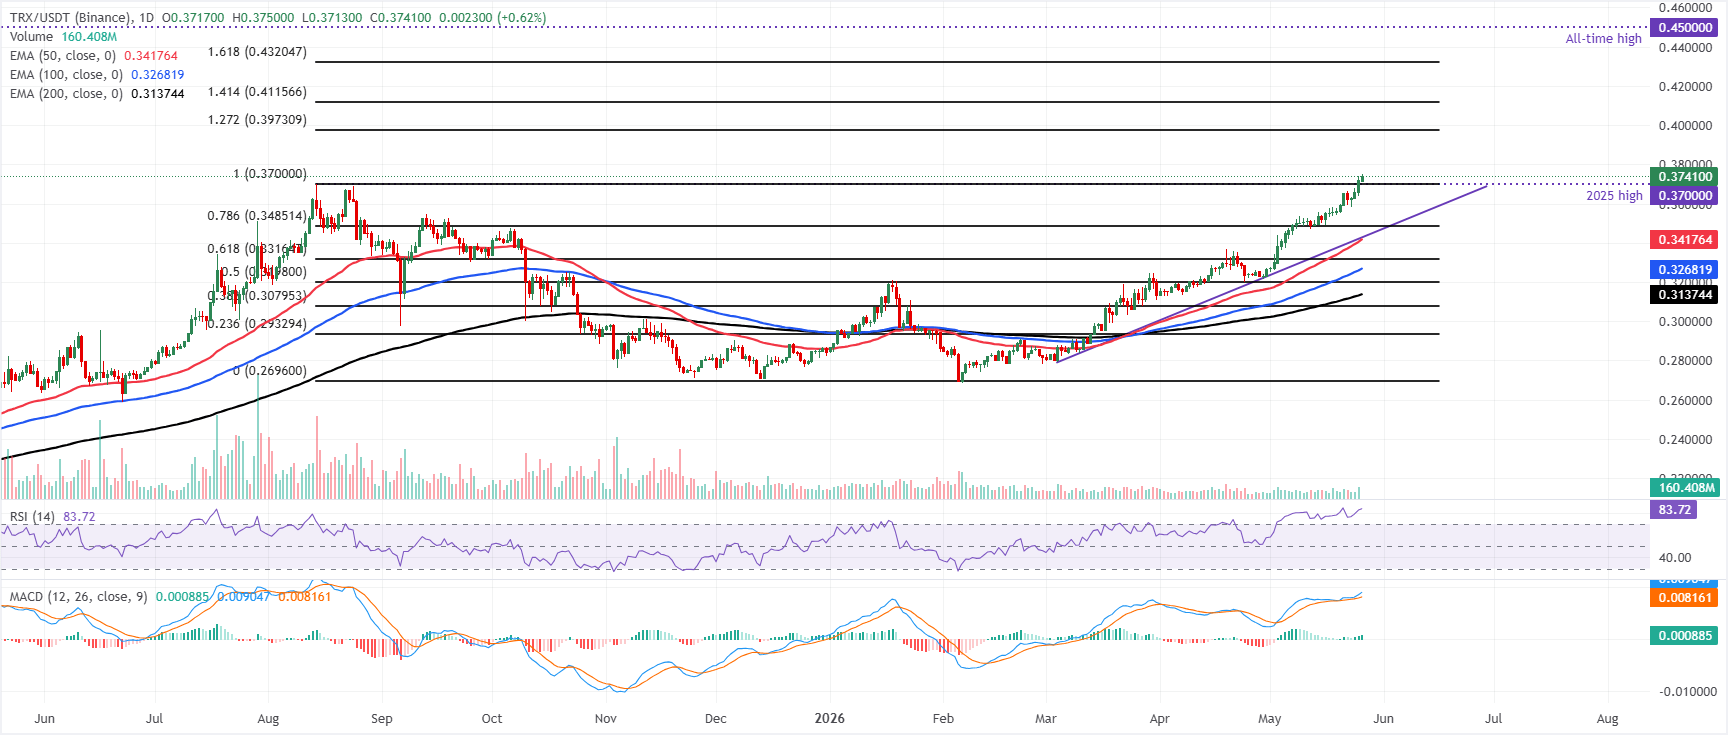
Tron price trades at $0.374, extending its advance within a firmly bullish structure and holding well above the 50-day, 100-day, and 200-day Exponential Moving Averages (EMAs). The reclaim and push beyond the prior Fibonacci swing high at $0.370 reinforce a constructive near-term tone, while the Relative Strength Index (RSI) around 84 signals overbought conditions after a steep run. The Moving Average Convergence Divergence (MACD) indicator remains in positive territory, suggesting upside momentum remains in play, even as the overstretched RSI leaves the pair vulnerable to a corrective pause.
On the downside, immediate support is now seen in the recent breakout region around $0.370, with additional demand likely to emerge near the 78.6% Fibonacci retracement at $0.348. Below there, a dense support cluster is formed by the rising trendline reference at $0.342, the 50-day EMA at $0.341 and the 61.8% Fibonacci retracement at $0.3316, while deeper pullbacks would look to the 100-day EMA at $0.3268 and the 50% retracement at $0.3198.
With no clear resistance levels mapped overhead in the current dataset, the path of least resistance remains to the upside, with the psychological level at $0.400 as the next target, as long as price sustains above this layered support zone.
(The technical analysis of this story was written with the help of an AI tool.)














