


Key Takeaways:
• A doji candle is a psychology snapshot of balance, not a directional forecast by itself.
• The main types of doji candles are Gravestone, Dragonfly, Long Legged, Four Price and Doji Star
• A spinning top candlestick looks similar but is not the same as a doji, and the difference matters for confirmation rules.
• The highest probability doji candlestick pattern setups combine trend context, key levels, and a defined invalidation point using the doji range.
What is Doji Candle: Meaning and Context in Trends
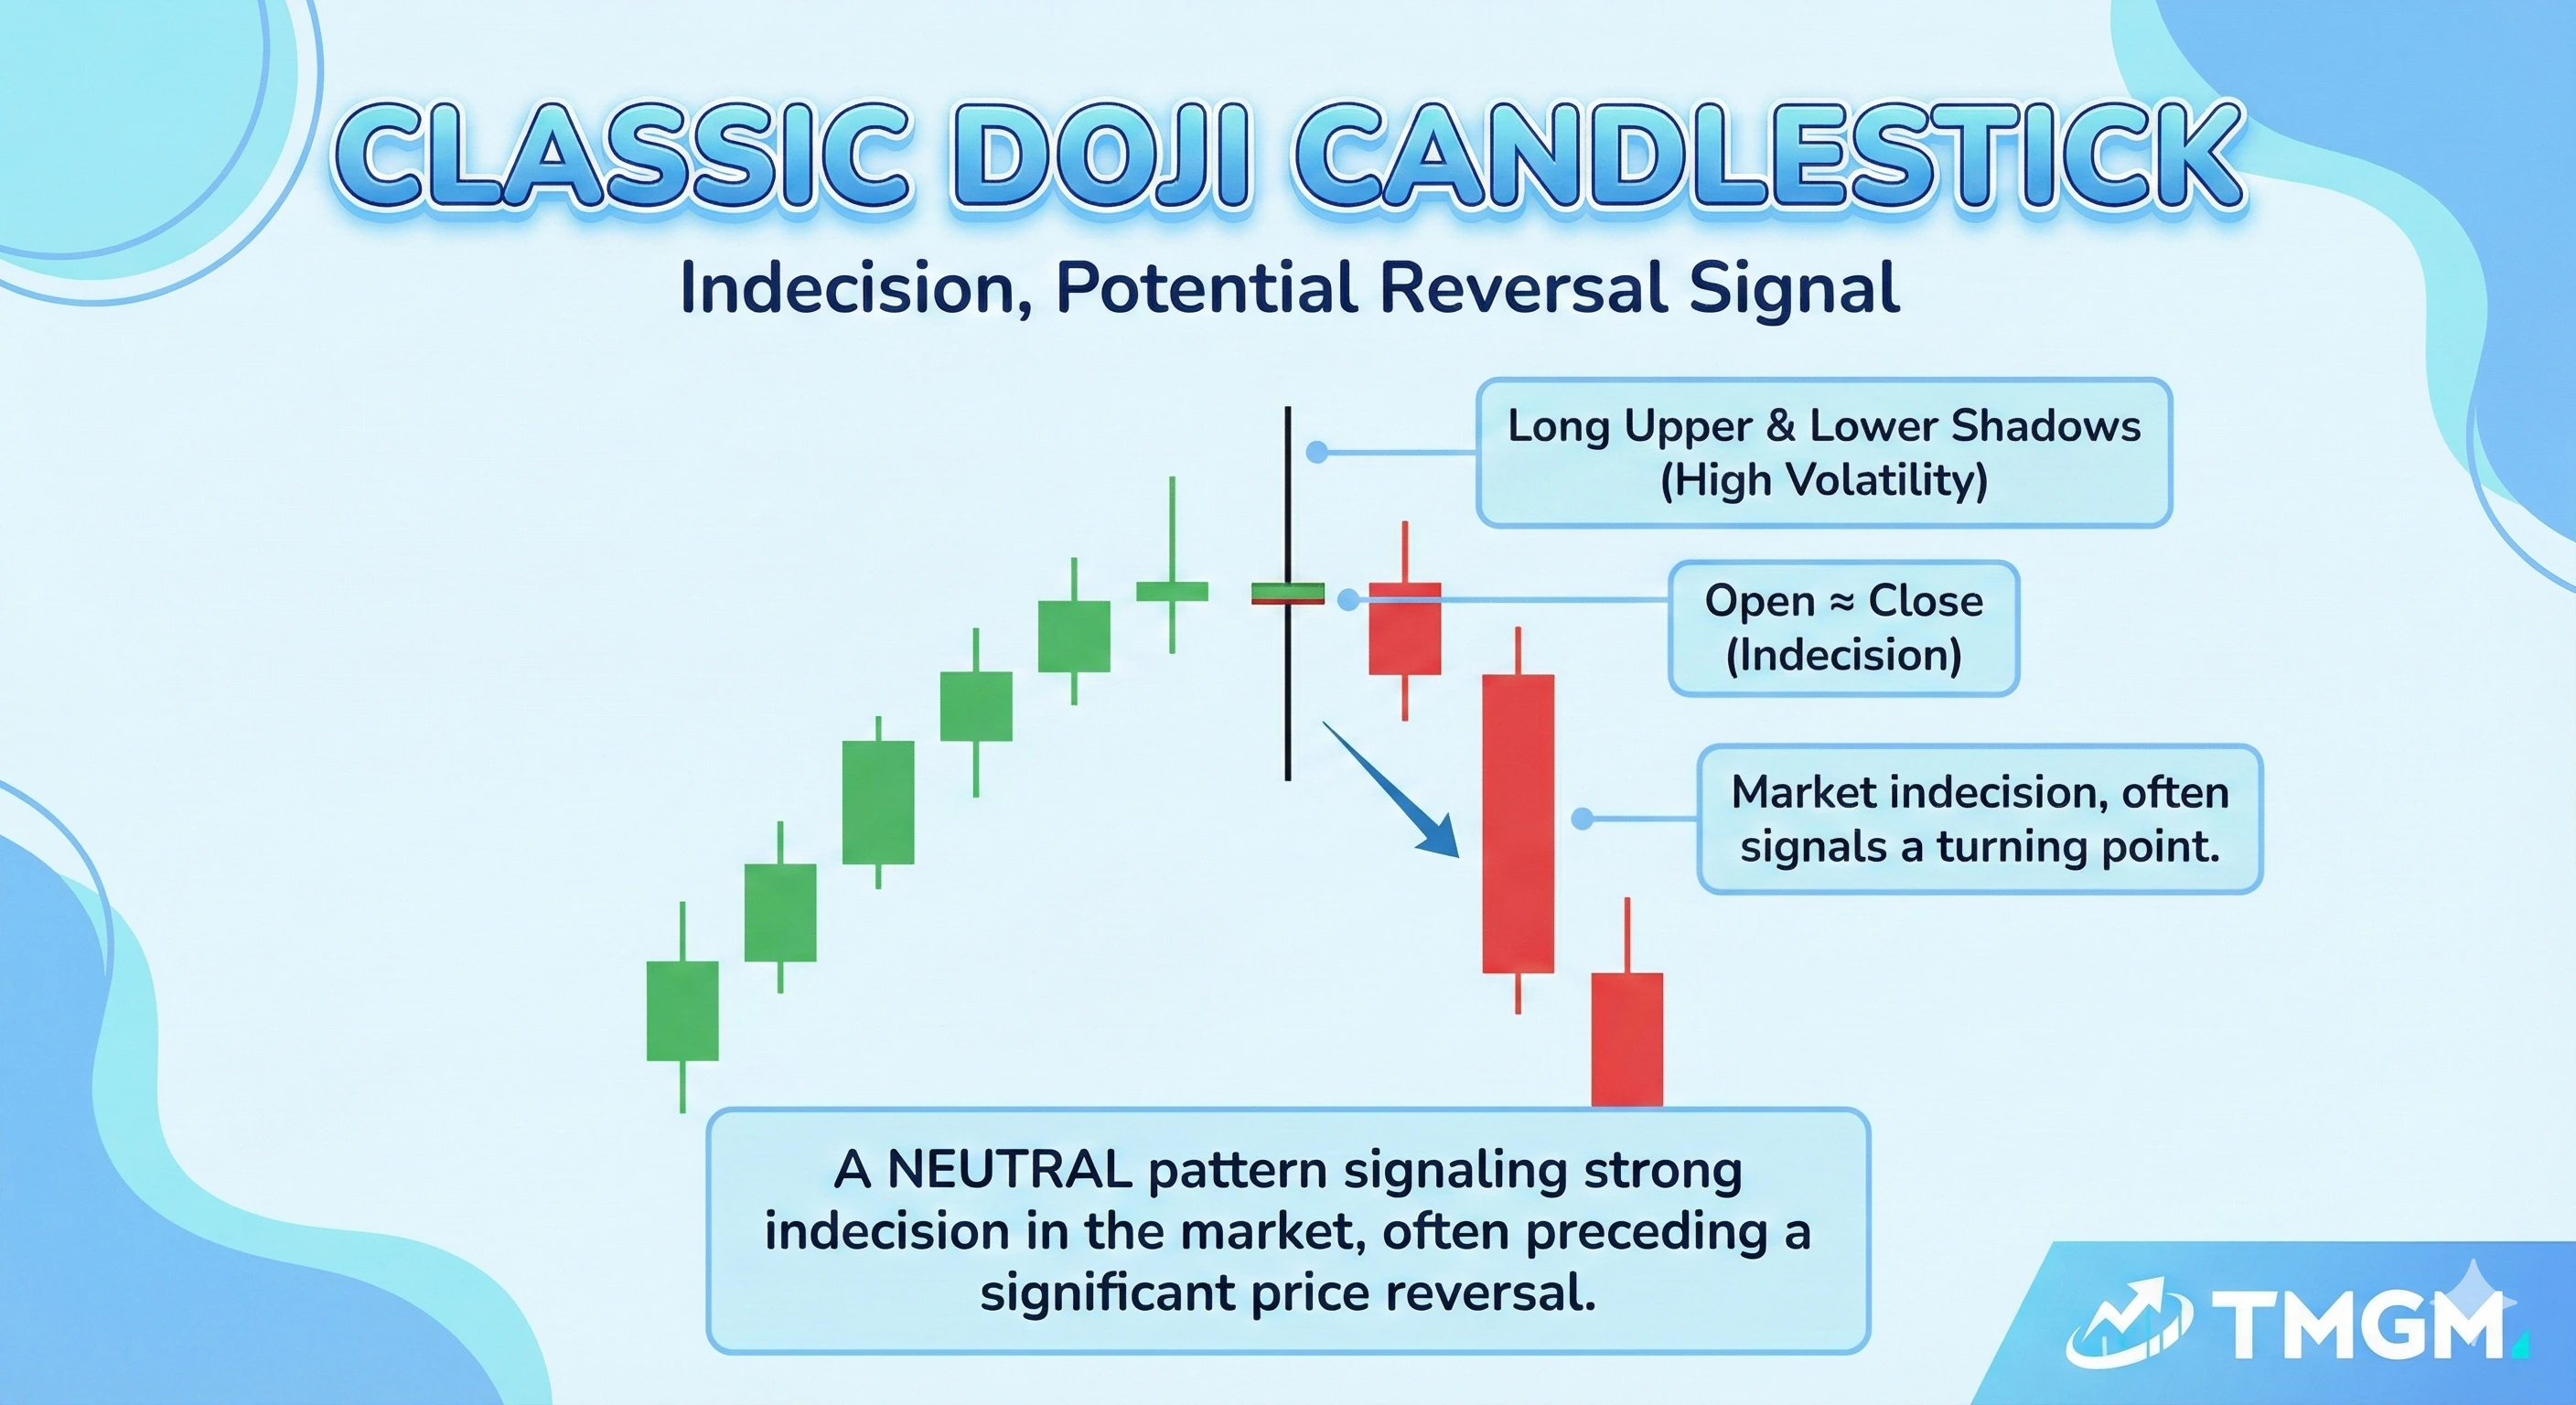
A doji candlestick forms when buyers and sellers push price around but neither side keeps control into the close. That is why a doji pattern often appears as a cross-like shape and is interpreted as either hesitation or a pause in conviction.
It is a very commonly seen candlestick pattern and it is widely used by day traders and swing traders who heavily use technical analysis in their trading process. This candlestick provides the early signal that the momentum of a particular price trend is slowing down, hence the push back from the opposite side caused the long wick and small body.
Types of Doji Candlestick Patterns
A doji is defined by the body, but traders read the wicks to understand where the battle happened.
Gravestone Doji
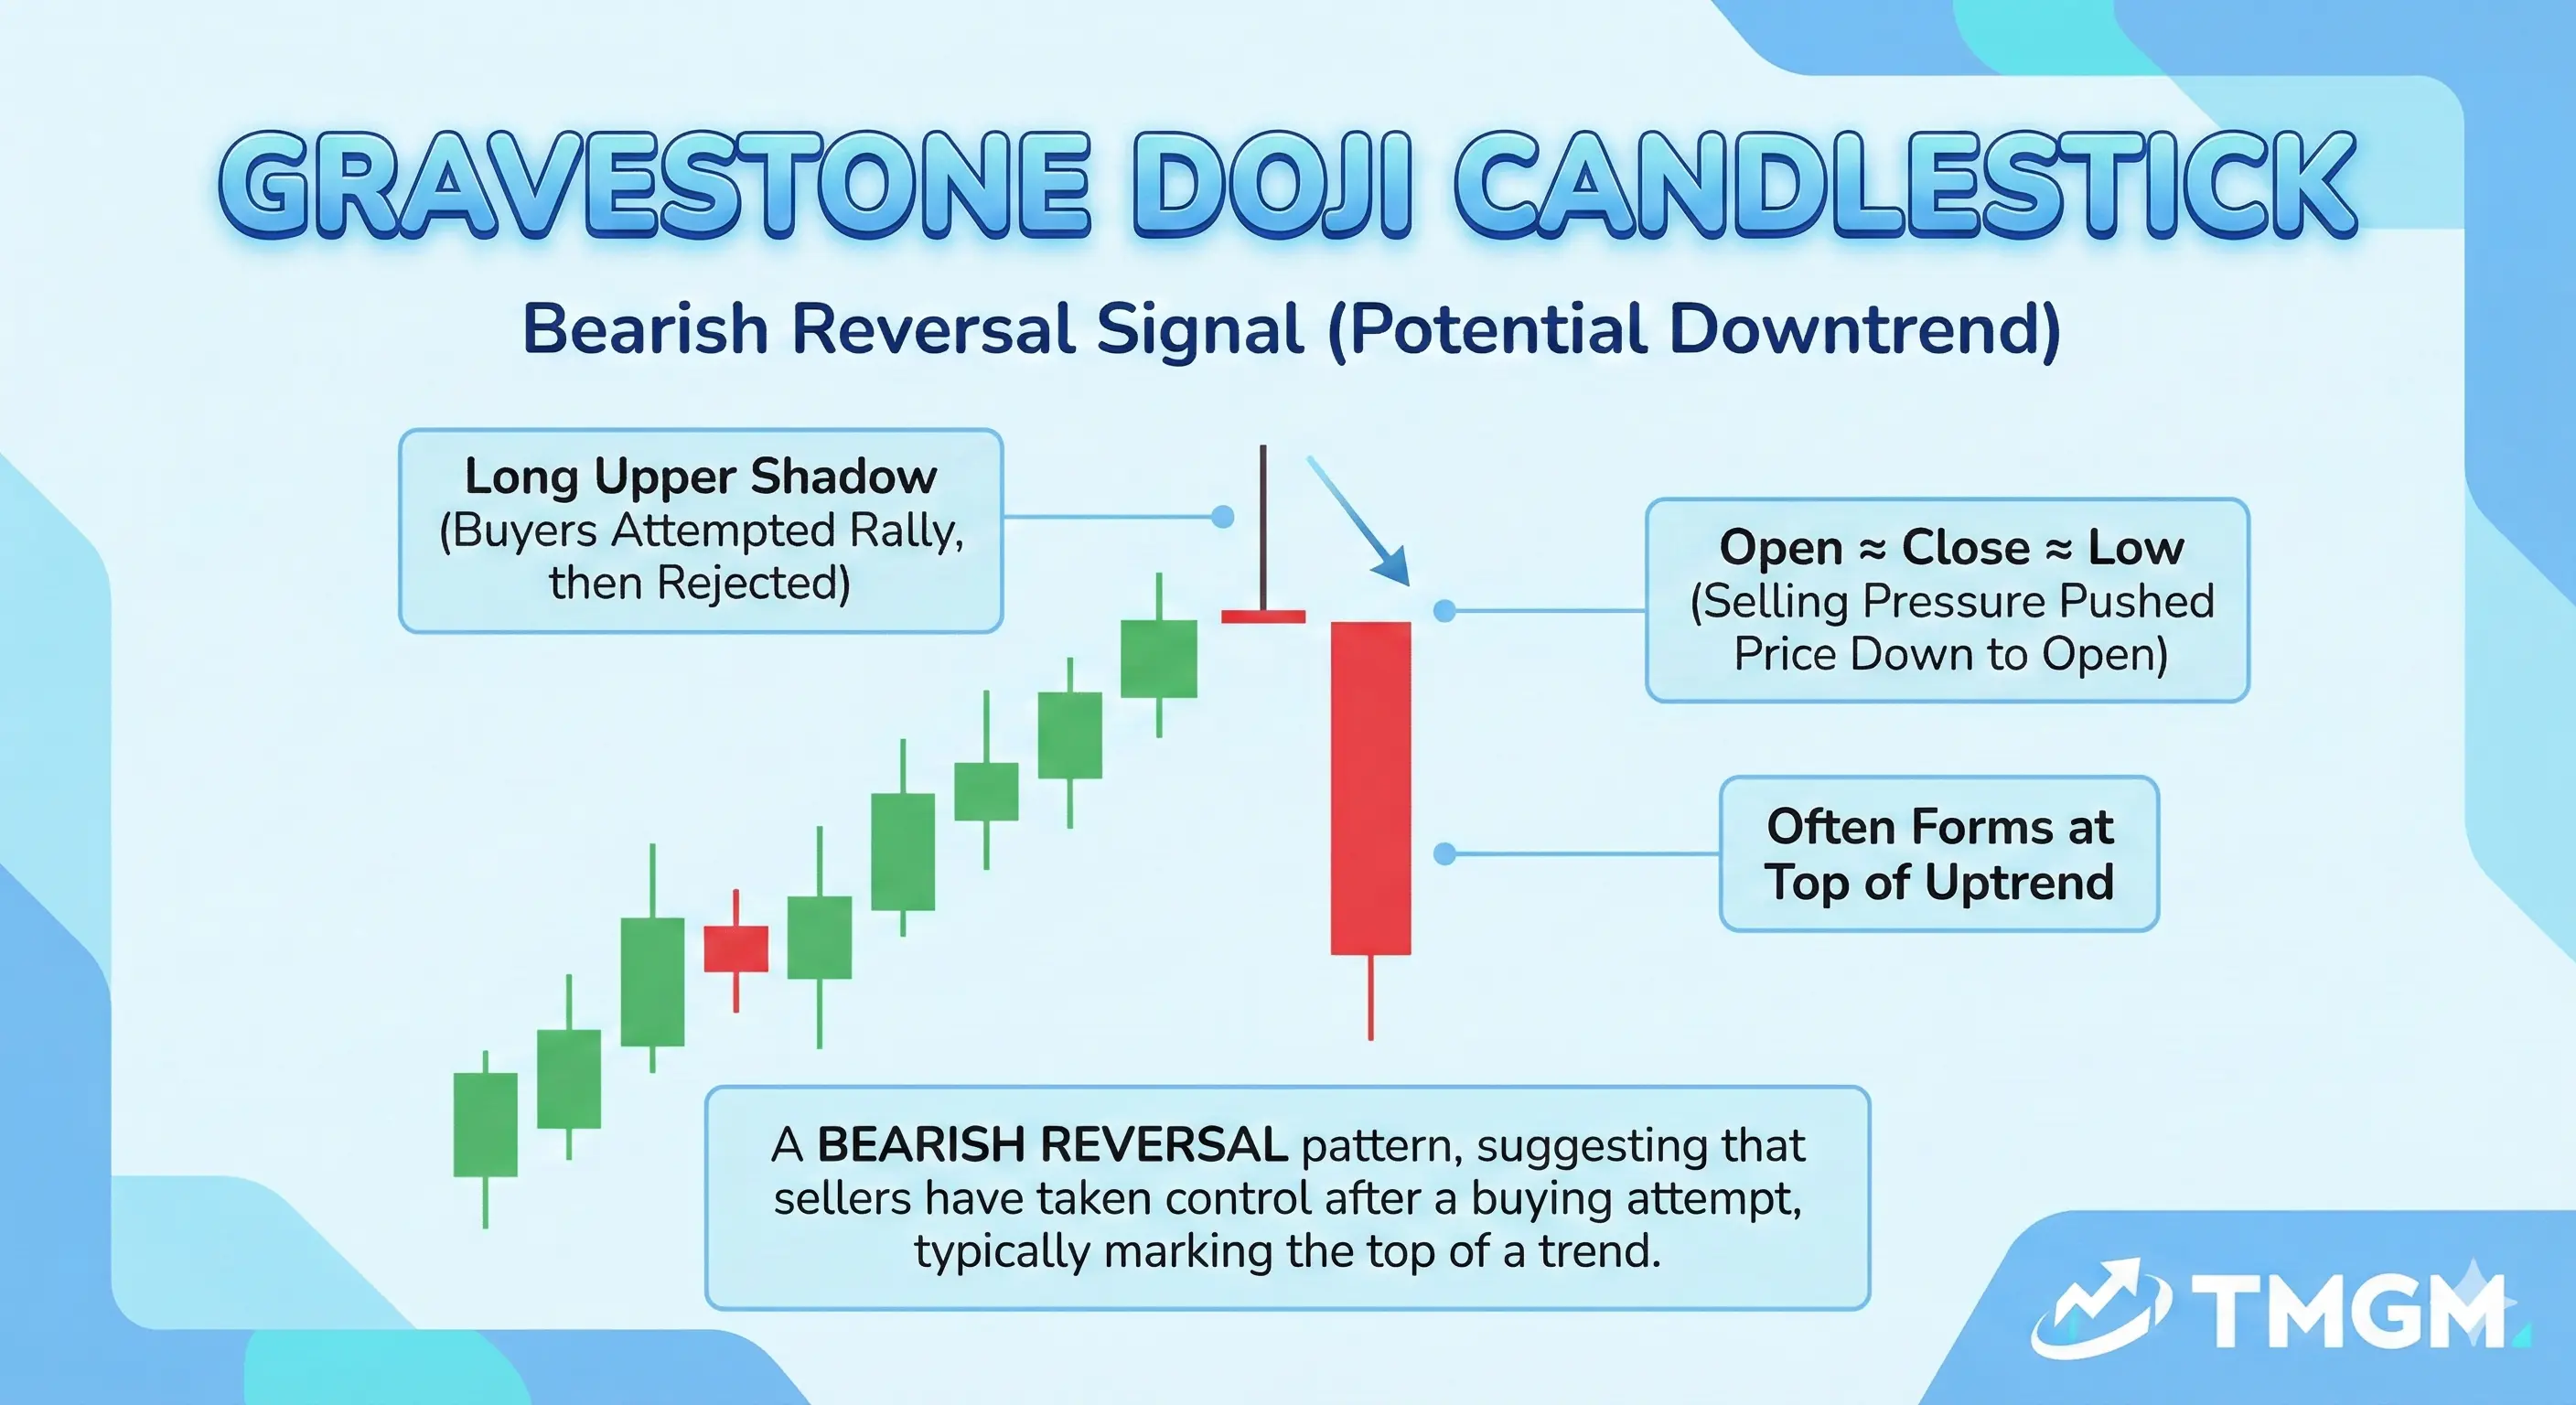 A gravestone doji candlestick has a long upper wick and little to no lower wick. It often shows aggressive buying that failed to hold, which can matter most after an uptrend or at resistance.
Dragonfly Doji
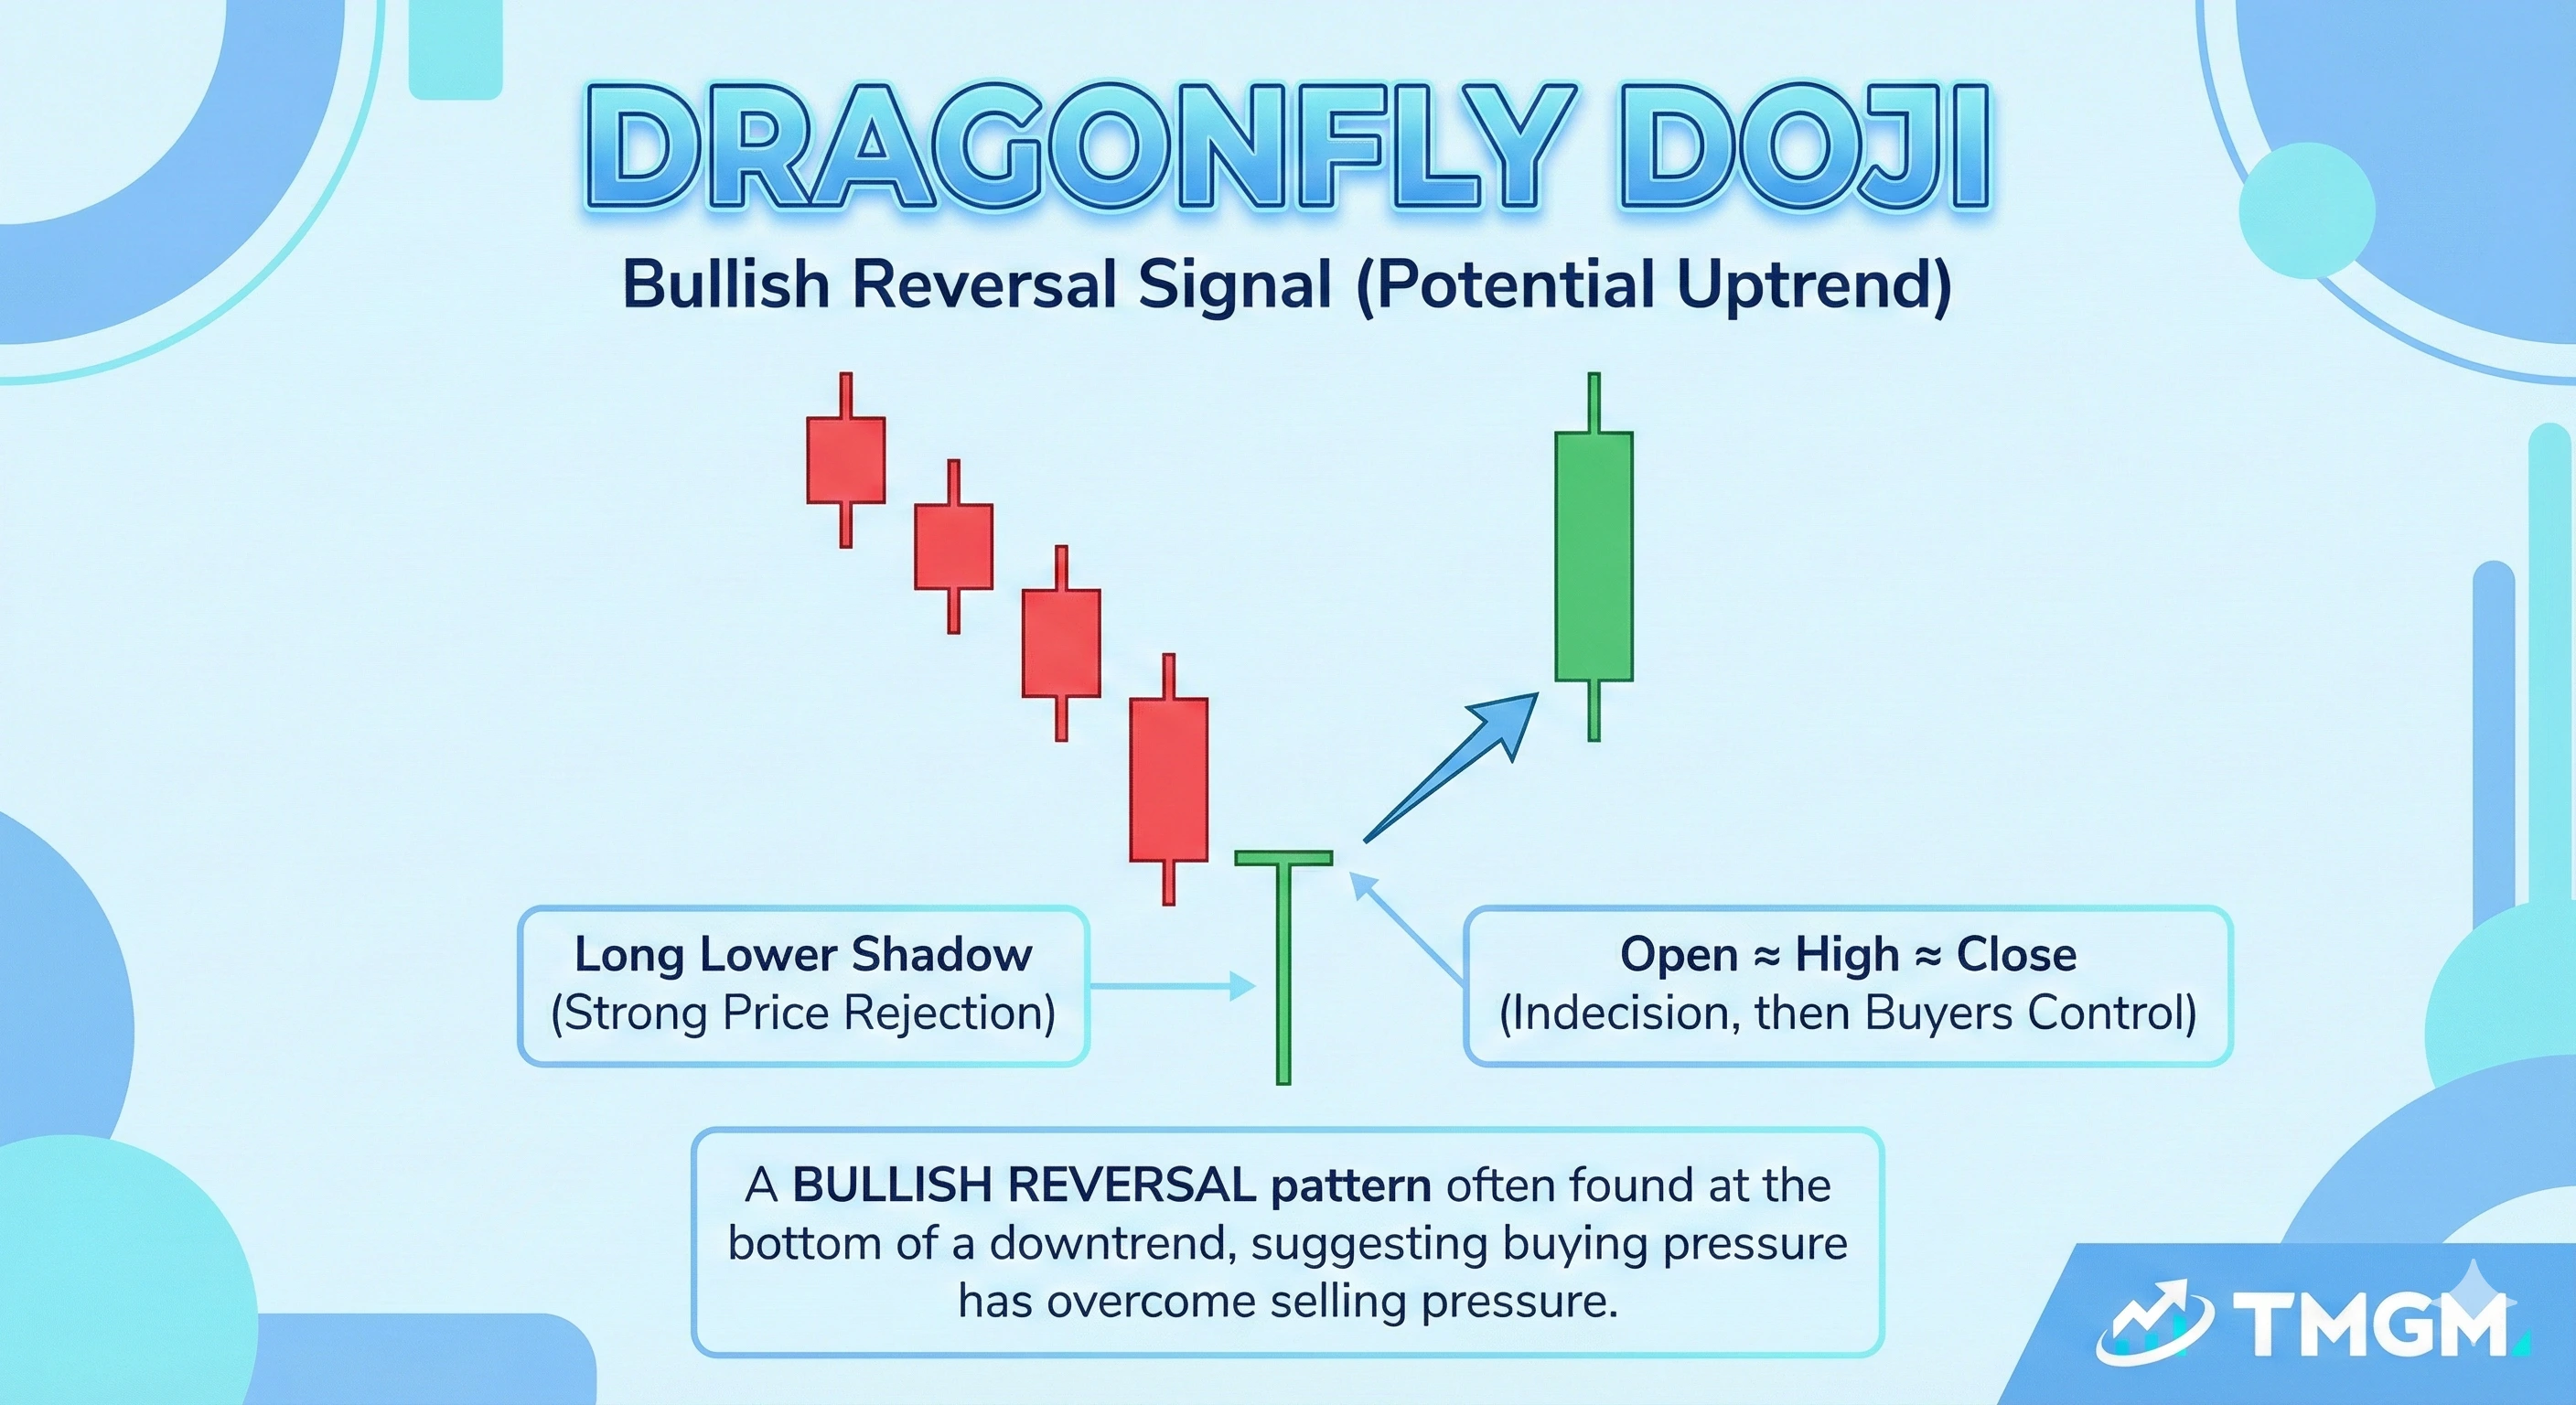
A dragonfly doji has a long lower wick and little to no upper wick. It often shows selling that was absorbed and rejected, which can matter most after a downtrend or at support.
Long Legged Doji
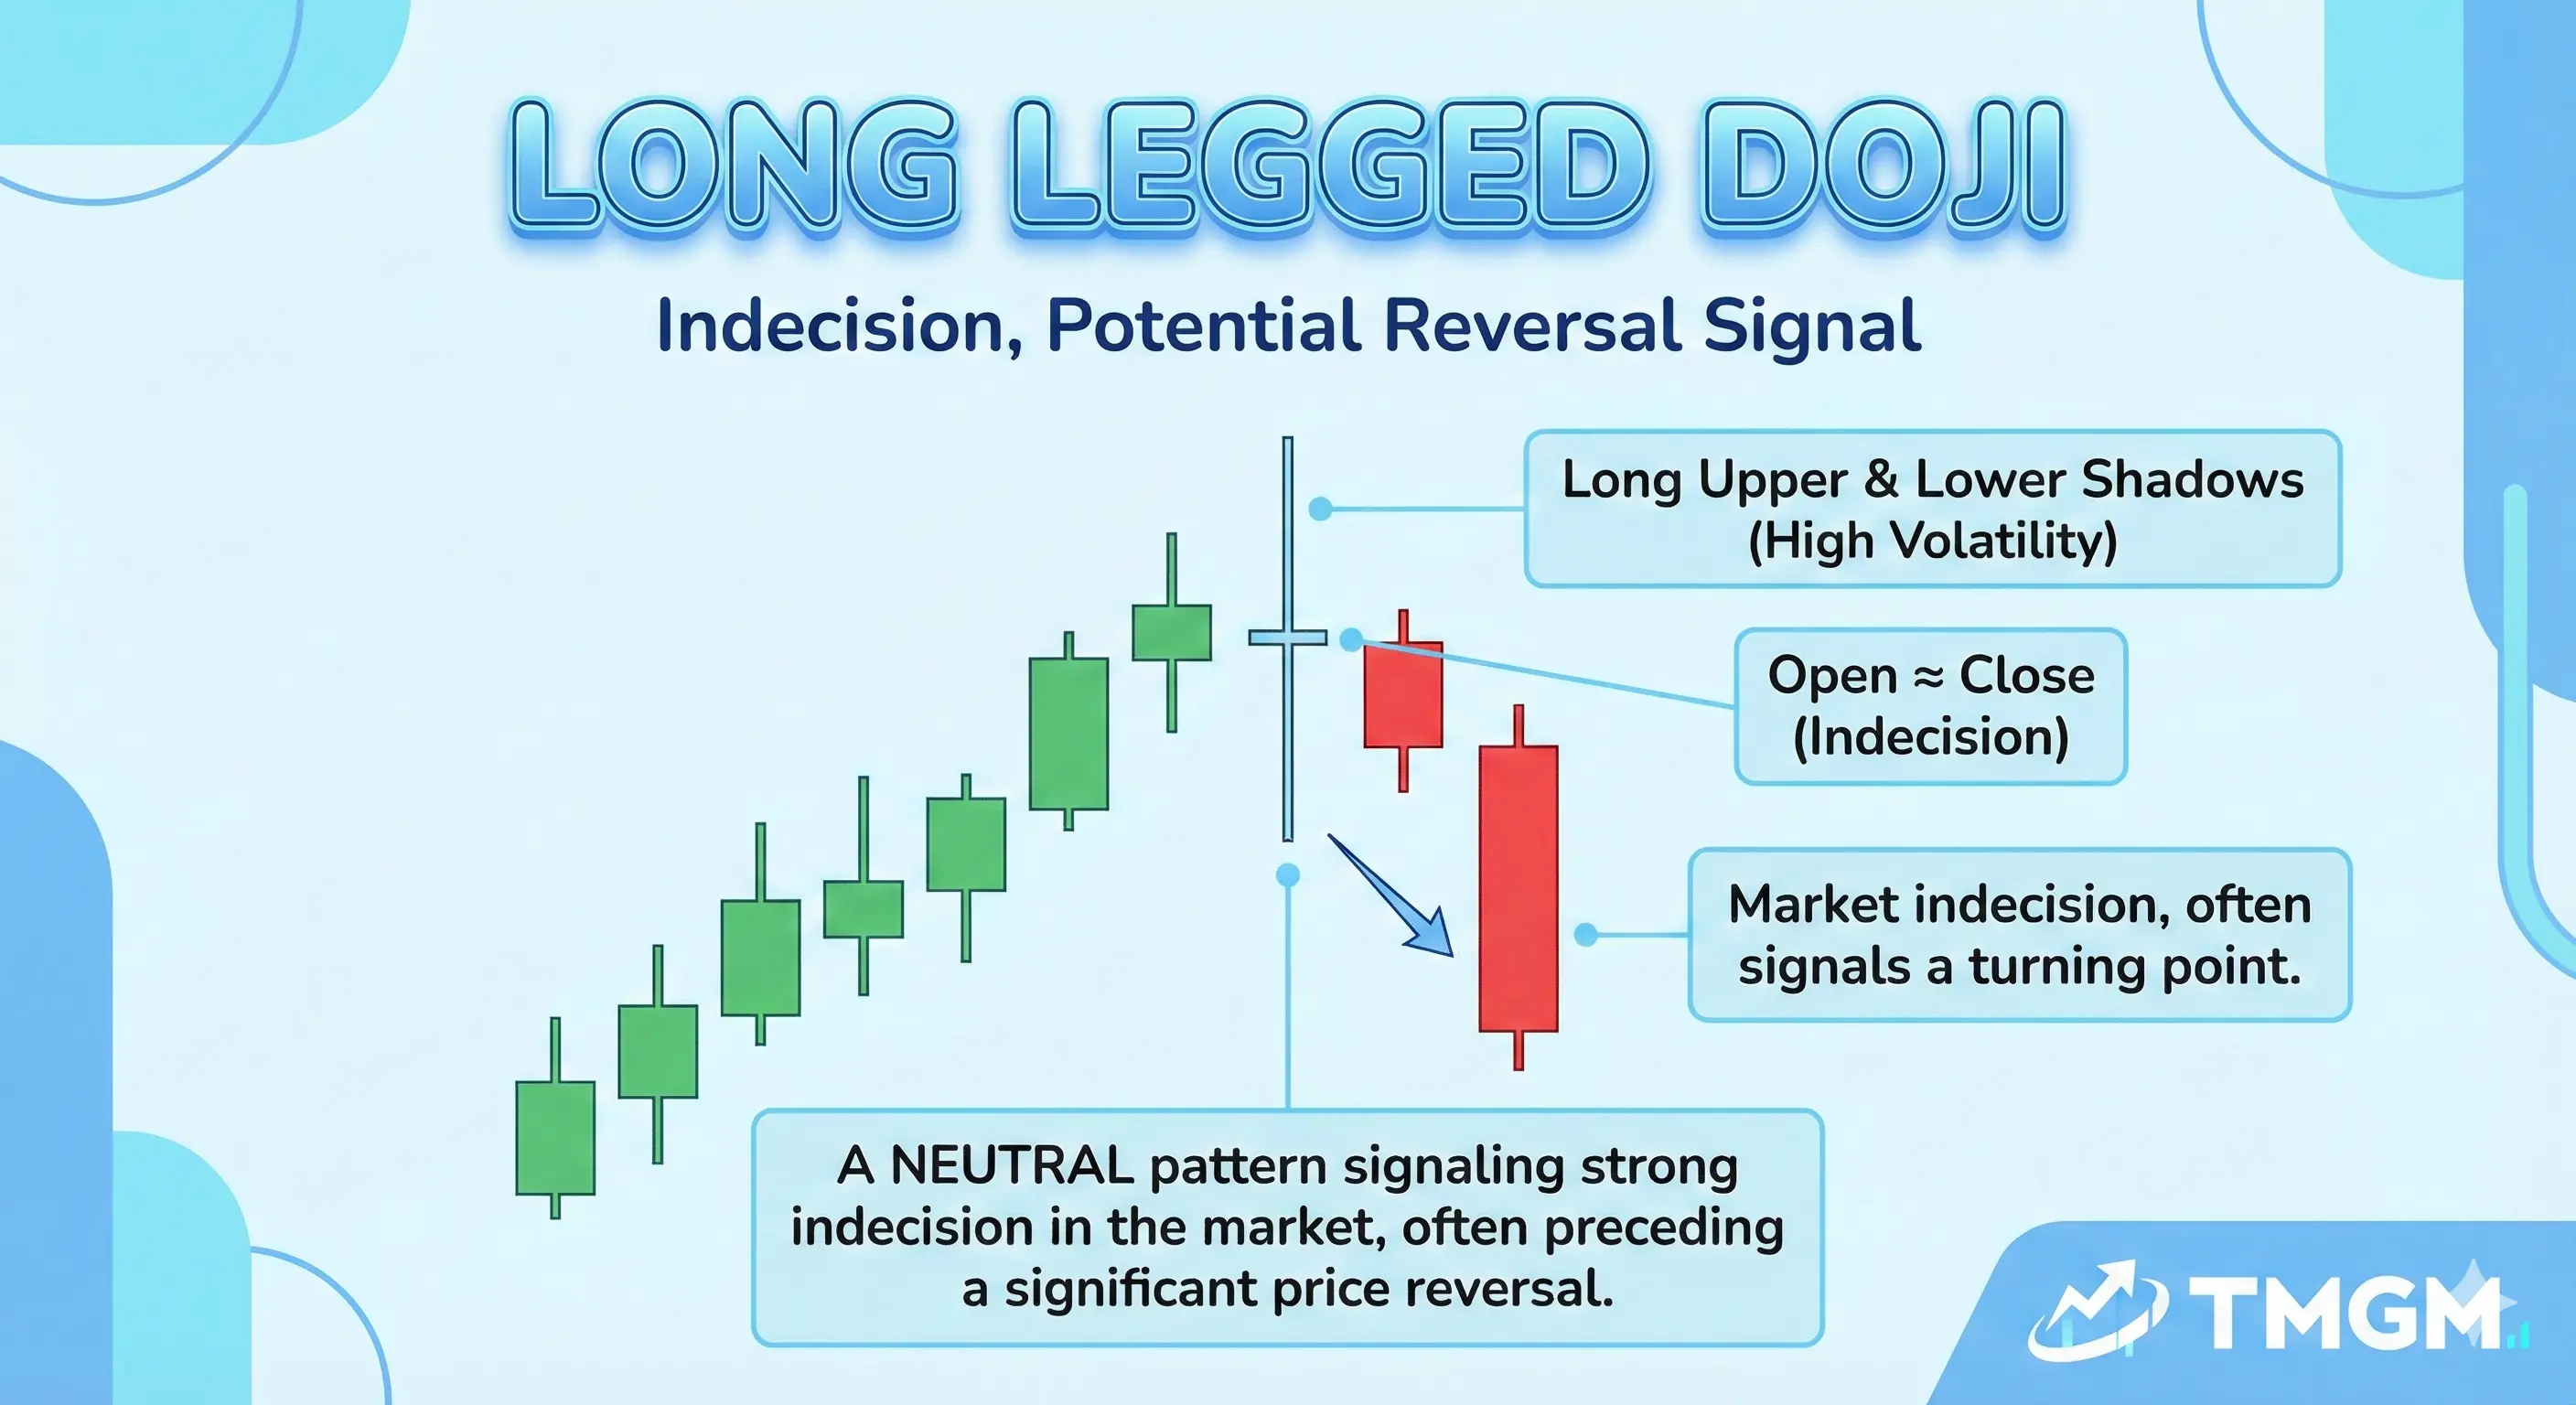
A long legged doji, sometimes considered as the same as Classic Doji, has long upper and lower wicks, showing wide disagreement during the candle but a balanced close. This is often seen during high uncertainty, news driven volatility, or near key inflection zones.
Four Price Doji

A four price doji has open, high, low, and close nearly identical. It usually reflects extremely low movement or a very tight range, so it often needs extra filtering because it can be a micro noise candle.
Doji Star
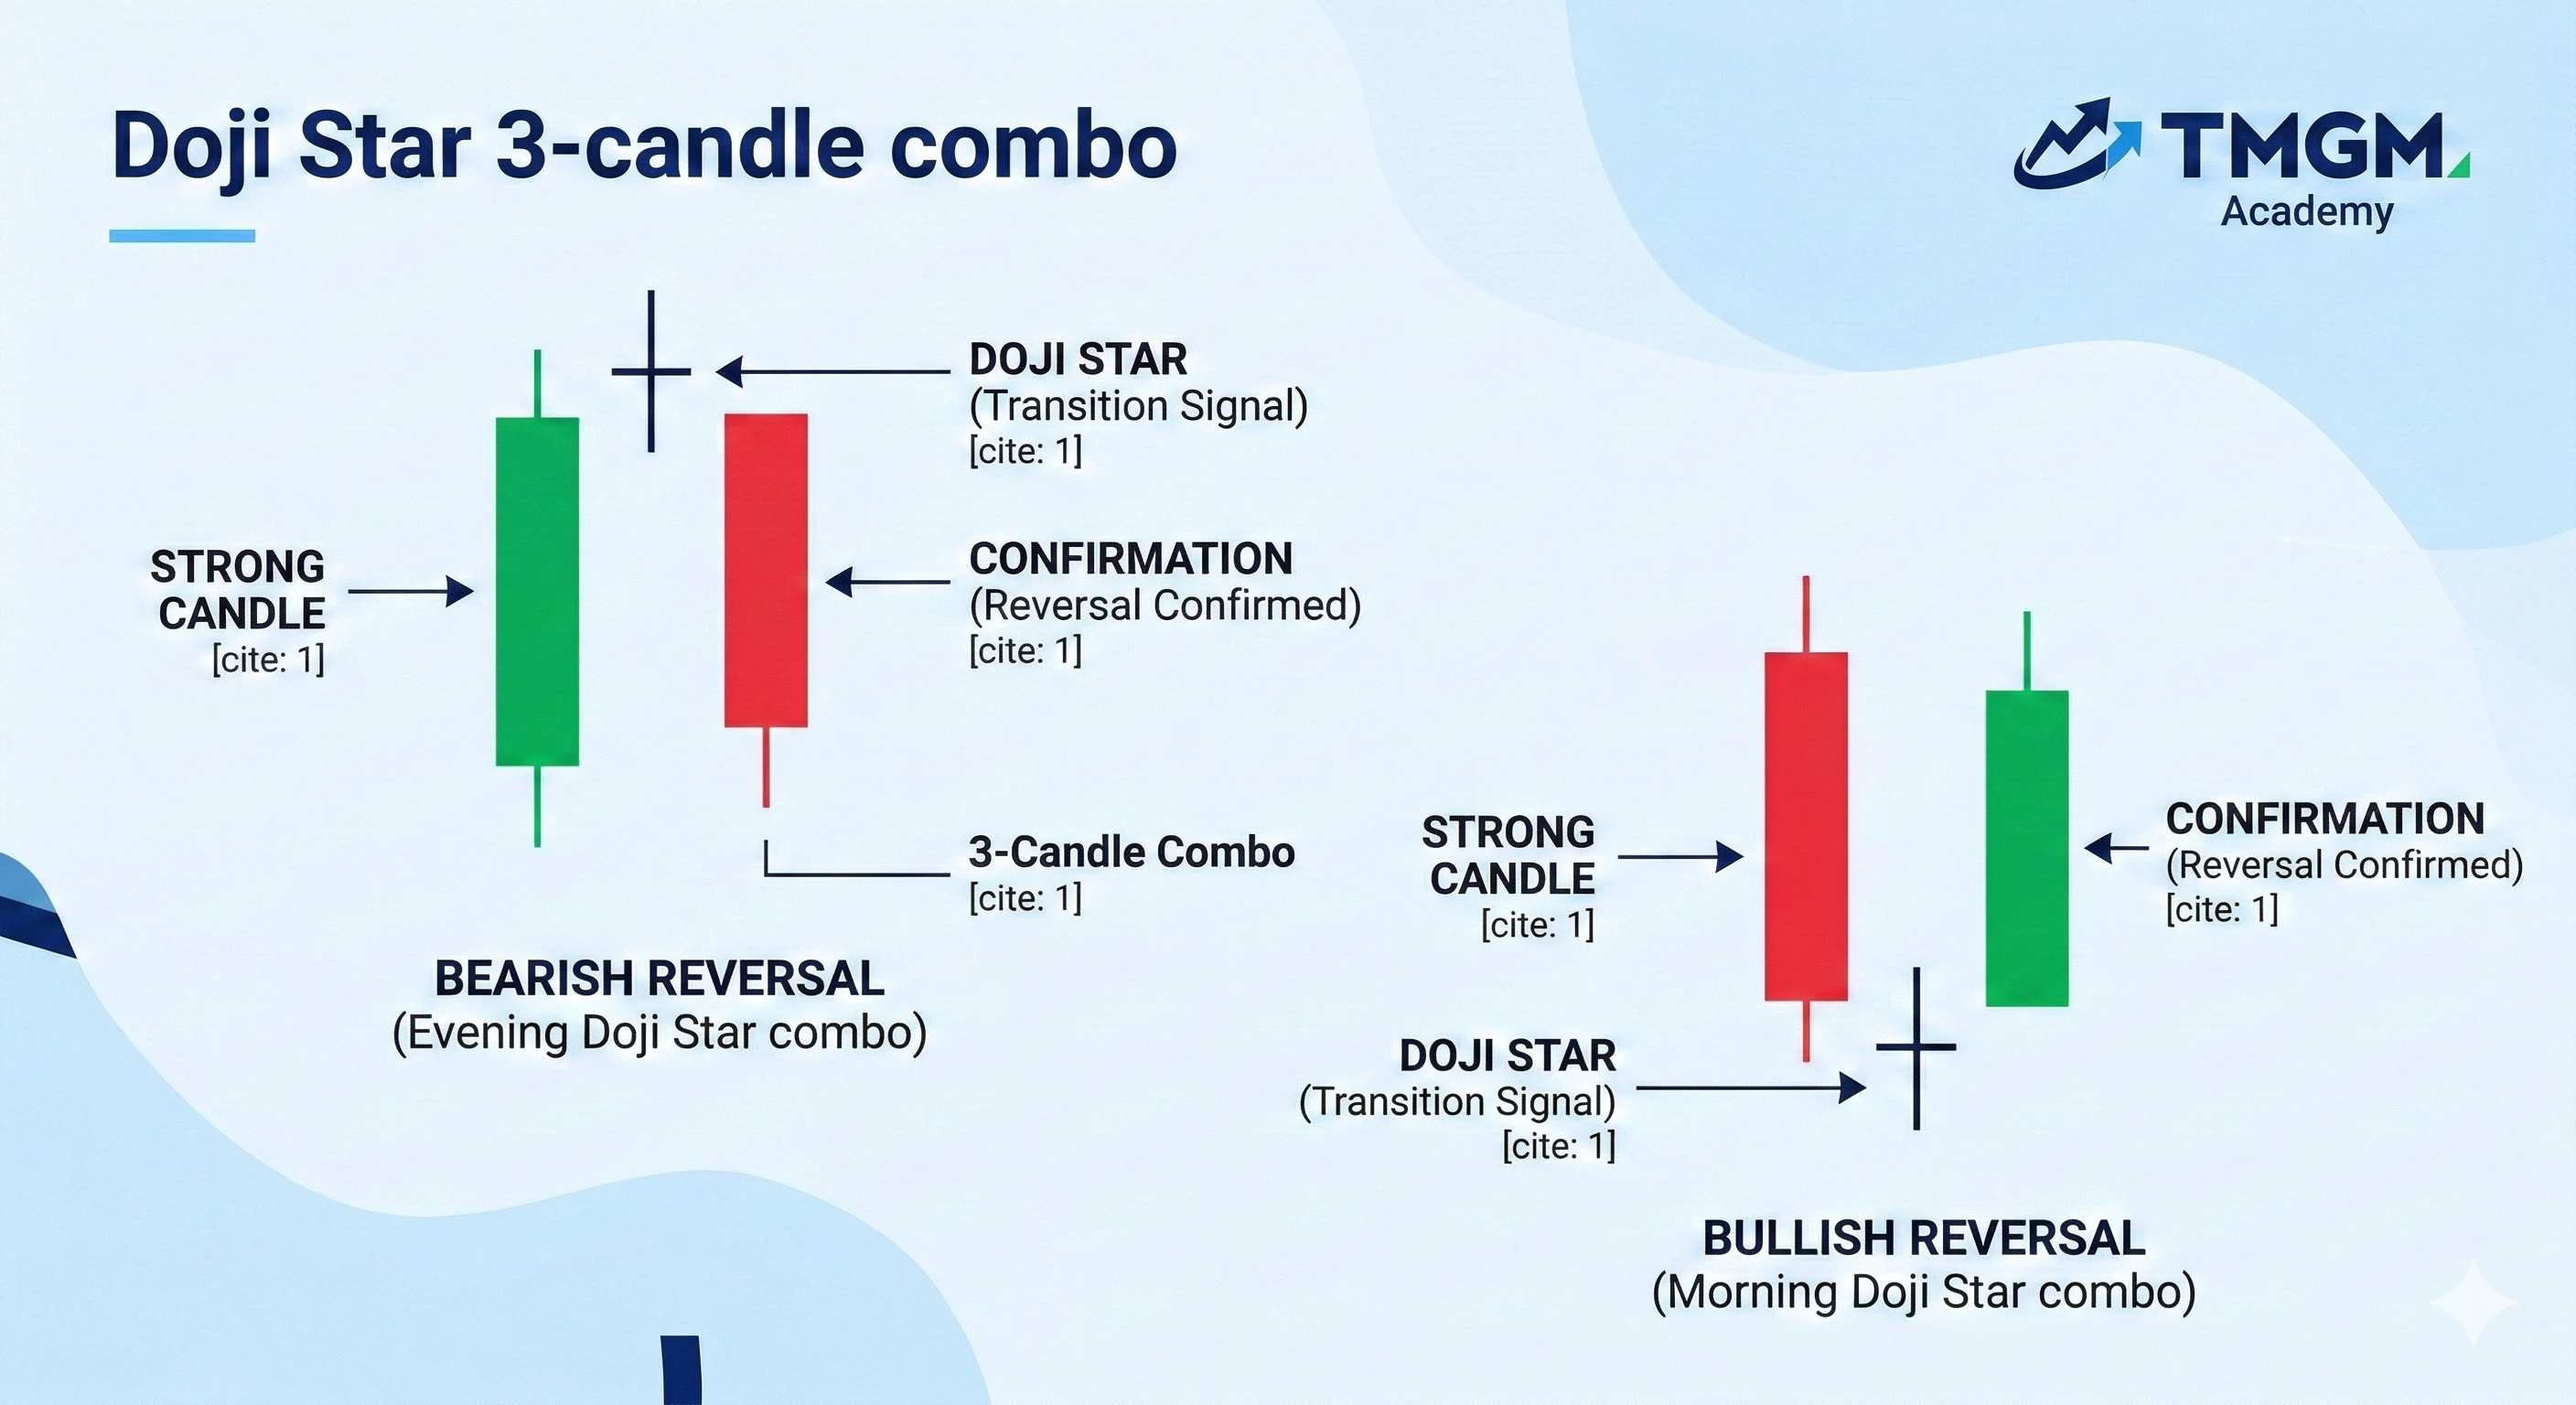
A doji star is a doji type that is specifically used in a 3 candlesticks combo. It is usually printed after a strong candle and is treated as a potential transition signal. Traders usually wait for the next candle to confirm reversal.
Common Confusions:
A reversal doji candlestick is not a special candle type, it is a context label. The same candle can precede a reversal or a continuation, depending on whether it prints into exhaustion after a trend or inside a routine consolidation.
A green doji candle and a red doji candle usually do not change the core message, because the defining feature is the near equal open and close. What matters more is where the open and close sit inside the wick range and how the next candle confirms.
Doji vs Spinning Top Candlestick Pattern
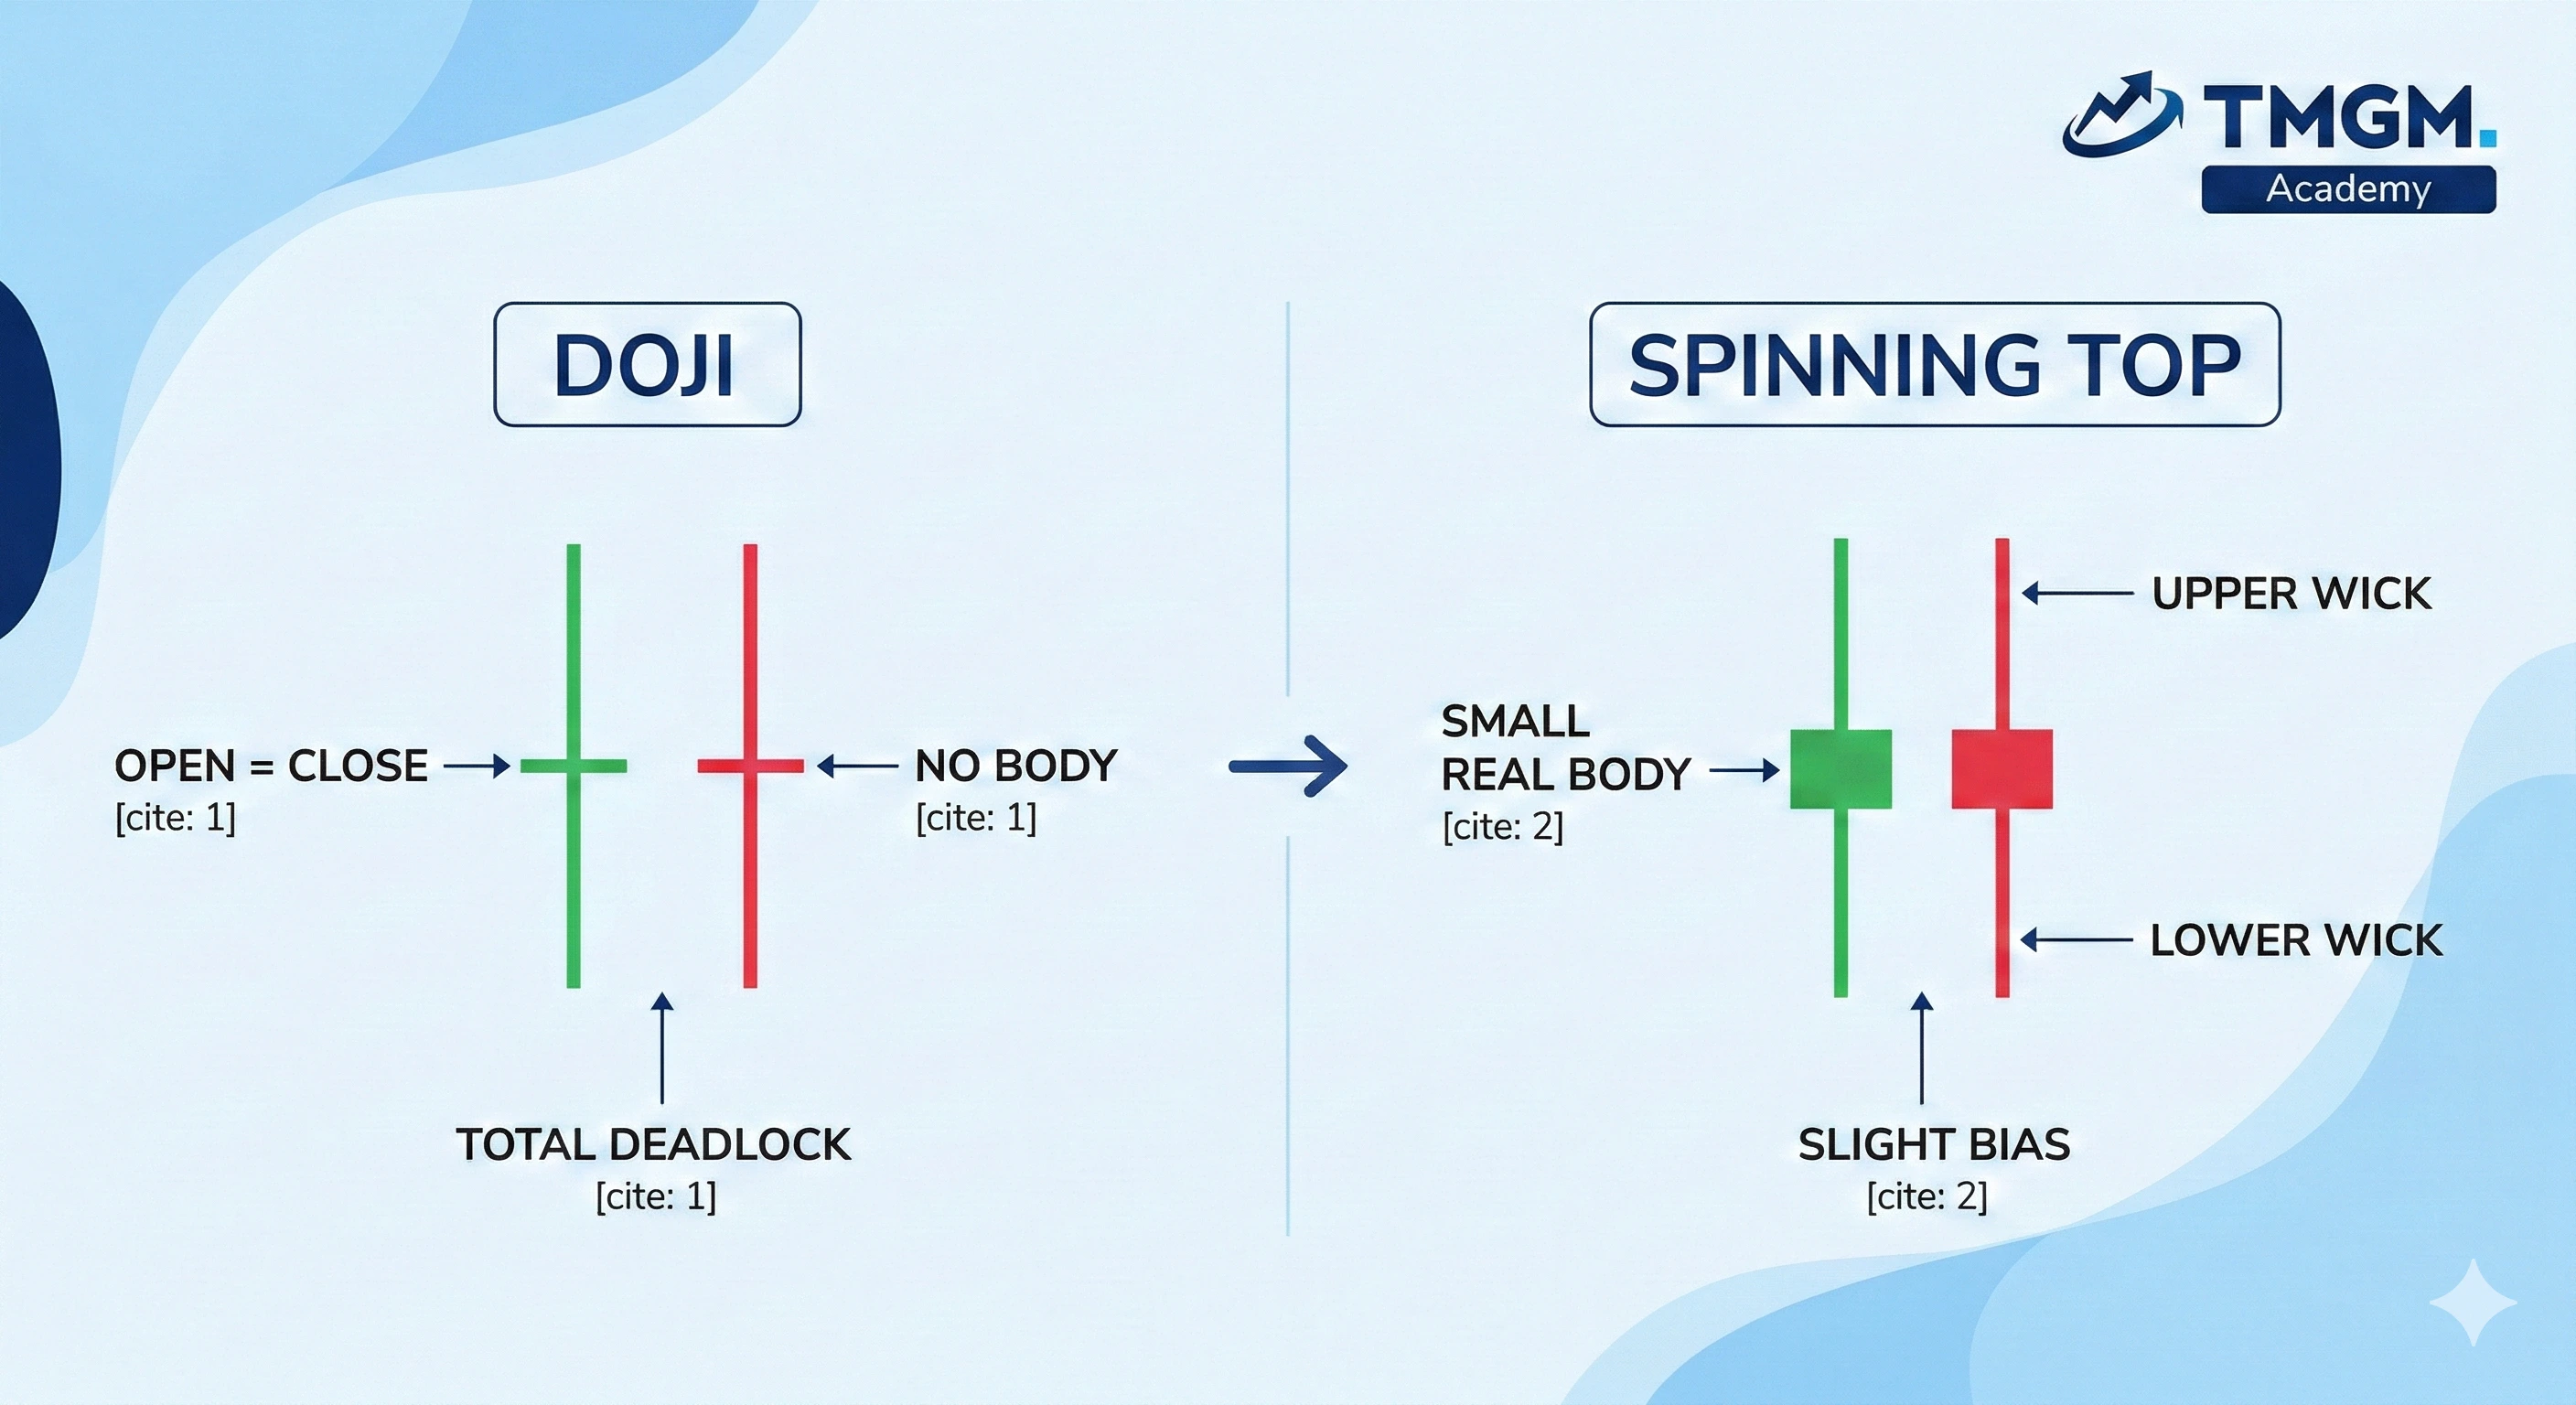 Novice traders frequently confuse the Doji candlestick with the Spinning Top candlestick pattern, but their structural nuances dictate completely different order flow realities.
A spinning top candlestick has a small body and wicks on both sides, but the body is usually more visible than a doji. A spinning top candlestick pattern can still signal indecision, yet it implies slightly more directional progress than a doji because open and close are not as tightly aligned.
The practical difference is confirmation strictness. With a doji, traders often demand a clearer confirmation candle or a range break, because the doji itself says the market ended the session undecided.
How to Trade Doji Candles with Confirmation, Strategy and Risk Awareness
Doji Candlestick Trading Strategies: Traders most often trade Doji Candlesticks Pattern with Breakout Strategy. Traders look for a Doji at support/resistance levels then wait for the price to break above the high (bullish) or below the low (bearish) of the Doji candle for confirmation.
A doji can look like a clean trigger, but every trader needs confirmation rules (Confluence) to validate it.
1) Identify the Doji Candle
Confirm the body is obviously small relative to recent candles. If the body is not small enough, it could be closer to a spinning top than a doji.
2) Recognizing the trend
A doji after a strong trend signals exhaustion, but a doji in the middle of a strong trend can be merely a routine pause. Define whether you are trading continuation or reversal before you pick an entry rule.
3) Double-Check the Candlestick Pattern
Beware:
Long wicks show rejection zones and often map directly to liquidity sweeps. A long upper wick often means selling pressure above, and a long lower wick can signal demand below.
A large doji range can mean a more profitable range of breakout volatility, but it can also mean you will need wider stops and lower position size to exercise professional risk management. A tiny range can be noise, especially on lower timeframes, making the candlestick unreliable.
Pro Tip: A doji at a prior swing high or low has more meaning than one in open space. Combine it with support, resistance, trendlines, or a volatility regime filter rather than treating it as a standalone signal.
4) Look for confirmation signals
Confirmation Rules (or Confluence) include:
A close beyond the doji high or low
A strong follow through candle
Volume profile, explosive volume accompanied with breakout
Confluence from momentum tools like RSI divergence
Session Context (Context often comes from Fundamentals, Macroeconomic Data, News, Market Sentiment, etc)
Important: A doji candle is a neutral signal, which can signal strong momentum slowing down or reversing. So a trader must treat the confirmation rules (Confluence) as the real signal for entry, not the doji itself.
5) Take action based on your analysis
A common execution rule is to set a buy stop above the doji high for bullish confirmation, or a sell stop below the doji low for bearish confirmation. For range trading, entries often work better on rejection at the range edge rather than chasing the first break.
Pro Tip: Use the doji high and low as your invalidation map, because it naturally defines where the trade idea is proven wrong.
Original Research · Real Life USD JPY Doji Candlestick Daily Chart Analysis Case Study:
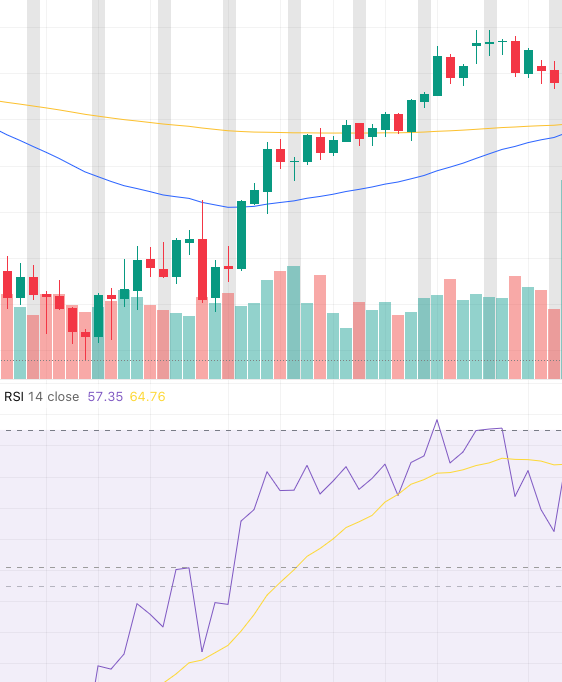
Doji Cluster at Resistance on USDJPY Daily Chart
Context: On Oct 28th 2024, USDJPY price was in a clear daily uptrend and then stalled at a known resistance zone. Instead of printing a clean continuation close above resistance, price started to hesitate.
What happened on the chart: Three consecutive doji candles formed near the same high area. Each session pushed higher intraday, then sellers rejected that upper zone and forced the close back near the open. The repeated long upper wicks show buyers could not hold new highs. The candle bodies stayed small, so the market kept signalling indecision, not follow through strength.
Why this matters: This is not a textbook gravestone doji, but the message is similar. Repeated rejection at the same price area, plus shrinking momentum, often signals trend exhaustion. When volume also fails to expand during the doji cluster, it strengthens the idea that buyers are running out of fuel.
The confirmation: After the third doji, the next candle turned bearish and closed decisively below the doji cluster low, also taking out the prior day low. That follow through candle arrived with stronger bearish volume, which is the shift traders look for before treating the doji cluster as a reversal signal. RSI also stepped down during the bearish break, supporting the momentum shift.
Analysis Confirmation Checklist:
Doji candles are real: Opens and closes are nearly the same, bodies are small.
Three dojis in a row: A cluster, not a single doji.
Long upper wicks: Rejection is repeated at the same upper zone.
Break candle confirms: The candle after the third doji closes below the cluster low and below the prior day low.
Bearish volume expands: Volume is stronger on the bearish break candle than during the doji cluster.
Bearish candle body is decisive: Wide real body, not another small body.
Follow through continues: The next candle also pushes lower, confirming seller control.
Volume confluence is clear: Weak participation during the stall, strong participation during the break.
RSI turns down with the break: RSI drops on the bearish candle, supporting the momentum reversal.
Conclusion and Action Plan learned:
Conclusion:
In this case, the market gave us very sufficient time to analyze and react. The market printed 3 consecutive Doji Candlesticks, which already gave us a very early signal of a momentum slow down.
Action Plan learned:
In this case, a trader can set a stop loss to be triggered, below the lower edge of the wick of the first Doji Candlestick that appeared, and as soon as the breakout (Big Red) candlestick prints, it will trigger the stop loss and close the position without riding the wave down afterwards.
Doji Candlestick Pattern Trading Tips
A doji works better when it aligns with a level that many traders already watch, like a prior swing high or low. It also tends to perform better when volatility is elevated enough to create meaningful follow through, rather than flat chop.
Is a Doji Candle Bullish or Bearish?
A doji is neither bullish nor bearish by definition. It becomes directional only after context and confirmation define whether the market resolved indecision upward or downward.
Advantages And Disadvantages of Doji Candlestick Pattern
The advantage is clarity, because the doji range gives clean reference points for entries and stops. Another advantage is that due to the simplicity of the price action mechanism, it is usable in all markets including Forex, Gold, Oil, Crypto, Stocks and so on.
The disadvantage is frequency, because dojis are common and many are simply noise without location and confirmation.
Common Misinterpretations of Doji Candlesticks
Assuming automatic reversals
A doji at the end of a trend can precede reversal, but it can also be a pause before continuation. Treat reversal as a hypothesis that must be proven by the next candle or a range break.
Ignoring surrounding price action
A doji against the trend in the middle of nowhere is usually a low quality signal. A doji at a tested level, after a clear impulse leg, is far more actionable.
Overemphasizing candle shapes
Traders sometimes memorize a doji candlestick pattern PDF cheat sheet and over trade every appearance. The shape matters less than the market structure around it.
Doji Candlestick and Risk Awareness
Increased uncertainty periods
Dojis often cluster around macro releases, session opens, and liquidity transitions. During these periods, spreads can widen and slippage risk can increase, so execution assumptions must be conservative.
Decision points for traders
A doji marks a moment where market control is undecided, which is why it is useful for defining risk. If price cannot break and hold beyond the doji range, it is often a signal to reduce size or avoid forcing a trade.
FAQ
What does a doji candlestick pattern mean?
It means open and close were nearly equal, showing indecision and a pause in momentum. The directional outcome depends on trend context and confirmation.
Is a doji candle bullish or bearish?
A doji is neutral by definition. It becomes bullish or bearish only after confirmation, such as a break above or below the doji range.
How reliable are doji candles for trading?
Reliability is situational. Dojis are most useful at key levels with clear trend context and confirmation, and least useful when they appear randomly in low volatility chop


