


Principais Conclusões:
O MACD (Moving Average Convergence Divergence) é um indicador de tendência e momentum que compara médias móveis exponenciais curtas e longas para gerar sinais de cruzamento, divergência e histograma, que os traders podem combinar com médias móveis, RSI, volume, níveis de Fibonacci e linhas de tendência em diferentes prazos para confirmar entradas e saídas, gerenciar risco e praticar estratégias em conta demo.
O MACD é calculado subtraindo a EMA de 26 períodos da EMA de 12 períodos para formar a linha MACD, depois calculando uma EMA de 9 períodos dessa linha como linha de sinal, e finalmente plotando o histograma como a diferença entre as linhas MACD e de sinal, para que os traders possam visualizar mudanças de tendência e força do momentum através desses três componentes.
Os traders frequentemente combinam o MACD com outras ferramentas, utilizando-o junto com médias móveis, RSI, análise de volume, retrações de Fibonacci e estratégias de linhas de tendência para confirmar tendências, momentum e potenciais reversões.
Os traders devem tratar o MACD como uma ferramenta de suporte, escolhendo prazos que correspondam à sua estratégia, combinando o MACD com outros indicadores, evitando mercados laterais, aplicando gestão rigorosa de risco e testando as configurações primeiramente em conta demo antes de operar ao vivo.
Você pode praticar estratégias com MACD sem arriscar capital real usando uma conta demo e experimentando diferentes combinações de indicadores e prazos até se sentir confiante.
É possível praticar estratégias com MACD sem risco utilizando paper trading ou contas demo para testar setups com fundos virtuais em tempo real e realizando backtesting das suas regras em dados históricos de preços, permitindo refinar as configurações do MACD, familiarizar-se com a plataforma e avaliar métricas de desempenho como taxa de acerto, relação risco-retorno e drawdown em diferentes condições de mercado, sem expor capital real.
O que é o Indicador MACD?
O MACD (Moving Average Convergence Divergence) é um indicador de análise técnica que revela mudanças na força, direção e momentum de uma tendência no preço de um ativo'. Ele é calculado subtraindo uma média móvel exponencial (EMA) de longo prazo de uma EMA de curto prazo, com configurações padrão geralmente sendo as EMAs de 12 e 26 períodos. Uma terceira linha, que é uma EMA de 9 períodos (Linha de Sinal) da própria linha MACD, é plotada para ajudar a identificar potenciais sinais de compra e venda através de cruzamentos.
Como o MACD é Calculado?
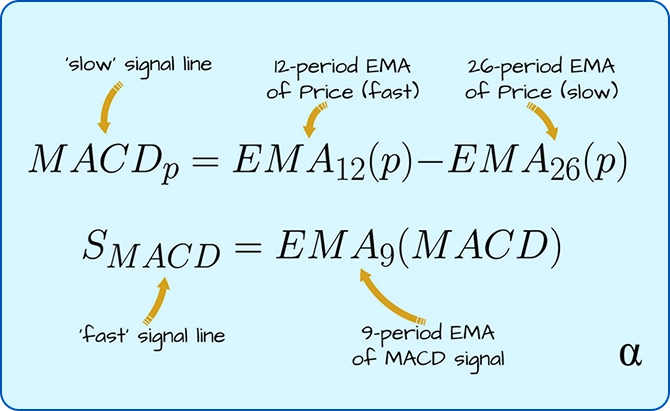
O MACD é calculado em três etapas: primeiro, subtraia a média móvel exponencial de 26 períodos (EMA) da EMA de 12 períodos para obter a linha MACD. Segundo, calcule a EMA de 9 períodos da linha MACD para obter a linha de sinal. Terceiro, subtraia a linha de sinal da linha MACD para criar o histograma.
Os Três Componentes Principais do MACD:
Linha MACD: A diferença entre as EMAs de curto e longo prazo, sinalizando mudanças de tendência.
Linha de Sinal: Uma EMA de 9 dias da linha MACD, que gera sinais de compra ou venda.
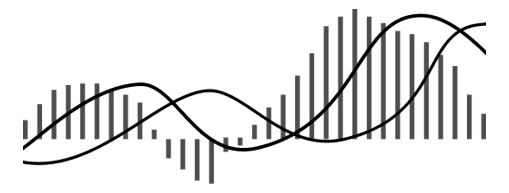
Histograma/Gráfico de Preços: Uma representação visual da diferença entre as linhas MACD e de sinal, indicando a força do momentum.
Histograma: Diferença entre as linhas MACD e de sinal
Como Identificar Cruzamentos do MACD & e Divergência do MACD?
1. Cruzamentos do MACD:
Os cruzamentos do MACD são um sinal de análise técnica que ocorre quando a linha MACD cruza sua linha de sinal, indicando uma possível mudança no momentum. Um cruzamento de alta acontece quando a linha MACD cruza acima da linha de sinal, sugerindo uma tendência de alta, enquanto um cruzamento de baixa ocorre quando cruza abaixo da linha de sinal, sugerindo uma tendência de baixa.
Cruzamento de Alta: A linha MACD cruza acima da linha de sinal — podendo sugerir momentum ascendente.
Cruzamento de Baixa: A linha MACD cruza abaixo da linha de sinal — podendo indicar momentum descendente.
2. Divergência do MACD:
A divergência do MACD é um sinal de trading que ocorre quando o preço de um ativo e o indicador MACD se movem em direções opostas. Isso sugere uma possível reversão na tendência do preço do ativo porque o momentum está divergindo da ação do preço.
Divergência Positiva: O preço forma mínimas mais baixas enquanto o MACD forma mínimas mais altas — podendo sinalizar uma reversão de alta.
Divergência Negativa: O preço forma máximas mais altas enquanto o MACD forma máximas mais baixas — podendo indicar uma reversão de baixa.
Como usar o Indicador MACD com outros Indicadores?
Como combinar MACD com Médias Móveis
Para combinar o MACD com médias móveis, use a média móvel para identificar a tendência principal e o MACD para confirmação de entrada e momentum.
Sinal de compra – Aguarde o preço estar acima da média móvel e a linha MACD cruzar acima da linha de sinal, idealmente com o histograma ficando verde e acima de zero.
Sinal de venda – O preço deve estar abaixo da média móvel, e a linha MACD deve cruzar abaixo da linha de sinal, com o histograma ficando vermelho e abaixo de zero.
Como usar MACD e RSI (Índice de Força Relativa)
Para usar o MACD e o RSI juntos, utilize o MACD para confirmar a força e direção da tendência' e o RSI (Índice de Força Relativa) para identificar condições de sobrecompra ou sobrevenda para potenciais pontos de entrada e saída.
Uma operação de alta pode ser confirmada quando o MACD mostra momentum ascendente e o RSI está saindo da zona de sobrevenda (abaixo de 30)
Uma operação de baixa é sugerida quando o MACD indica momentum descendente e o RSI está saindo da zona de sobrecompra (acima de 70).
Como usar MACD com Análise de Volume
O volume também pode ser usado para confirmar rompimentos e validar divergências no MACD, que podem sinalizar mudanças de tendência. Para usar MACD com análise de volume, combine os sinais do MACD com o volume para confirmar tendências e identificar potenciais reversões:
Procure aumento de volume durante um cruzamento de alta do MACD para confirmar uma tendência de alta mais forte
Procure queda de volume durante um cruzamento de baixa para confirmar enfraquecimento da tendência.
Combinando MACD com Retração de Fibonacci
Para usar o MACD com retração de Fibonacci, trace a ferramenta de Fibonacci em uma tendência clara de preço para identificar níveis potenciais de suporte e resistência, então procure um cruzamento do MACD nesses níveis de retração de Fibonacci para confirmar a entrada na direção da tendência.
Identifique níveis-chave: Foque nos níveis principais de retração como 38,2%, 50% e 61,8% como áreas potenciais de suporte (em tendência de alta) ou resistência (em tendência de baixa).
Use o MACD para confirmação: Aguarde o preço recuar até um nível chave de Fibonacci (como 38,2%, 50% ou 61,8%) e utilize um cruzamento de alta do MACD (linha MACD cruzando acima da linha de sinal) para confirmar uma possível entrada comprada.
Como usar MACD com Estratégia de Linhas de Tendência?
Para usar o MACD com uma estratégia de linhas de tendência, primeiro identifique a tendência e desenhe linhas de tendência no gráfico de preços. Em seguida, use os sinais do MACD para confirmação: procure um cruzamento de alta do MACD (linha cruzando acima da linha de sinal ou da linha zero) durante uma tendência de alta, ou um cruzamento de baixa durante uma tendência de baixa.
Um cruzamento do MACD que esteja alinhado com um sinal ou oportunidade de trading com linha de tendência aumenta a confiança na entrada da operação.
Rompimentos de linhas de tendência combinados com divergência do MACD podem sugerir sinais precoces de reversão de tendência.
Notas Importantes & Limitações do MACD
Escolha o Prazo Adequado: As opções flexíveis de gráficos da TMGM permitem selecionar prazos que estejam alinhados com sua estratégia de trading, seja de curto ou longo prazo.
Combine Indicadores: Para confirmar sinais do MACD, utilize as amplas ferramentas técnicas da TMGM, como Bandas de Bollinger ou retrações de Fibonacci.
Evite Mercados Laterais: Os dados de mercado em tempo real da TMGM ajudam a identificar tendências claras, evitando sinais não confiáveis do MACD em mercados instáveis.
Implemente Gestão de Risco: Use os recursos de stop-loss e take-profit da TMGM para proteger seu capital e garantir ganhos.
Pratique com Conta Demo: Você pode testar estratégias com MACD sem risco na conta demo da TMGM’ antes de aplicá-las em mercados reais.
Como Praticar Estratégias com MACD sem Risco?
Você pode praticar estratégias com MACD sem risco usando contas demo (paper trading) e backtesting. Esses métodos permitem aplicar suas estratégias em dados de mercado em tempo real ou históricos sem arriscar capital real.
1. Paper Trading (Contas Demo)
Paper trading, ou trading simulado, é a forma mais comum de praticar em um ambiente sem risco. A maioria dos corretores e plataformas de trading oferece contas demo gratuitas com fundos virtuais.
Como funciona: Você tem acesso a um conjunto completo de funcionalidades, incluindo dados de mercado em tempo real e ferramentas avançadas de gráficos, mas opera com dinheiro virtual. Isso simula a experiência real de trading sem exposição financeira.
Benefícios: Ajuda a familiarizar-se com a plataforma de trading, testar várias configurações do MACD e entender como o indicador se comporta nas condições atuais do mercado. Também auxilia no gerenciamento do aspecto psicológico do trading, embora a resposta emocional possa diferir do uso de dinheiro real.
2. Backtesting
Backtesting envolve aplicar sua estratégia MACD em dados históricos de mercado para verificar como ela teria performado no passado.
Como funciona: Você utiliza software especializado ou até análise manual em gráficos históricos para identificar sinais de trade passados e acompanhar lucros e perdas hipotéticos.
Benefícios: Esse método permite avaliar a eficácia e confiabilidade de uma estratégia em diversas condições de mercado (tendência, lateral, volátil) ao longo de longos períodos. Ajuda a identificar falhas na estratégia e determinar métricas-chave como taxa de acerto, relação média de ganhos/perdas e drawdown máximo.
Por que Operar com a TMGM?
A TMGM oferece um conjunto de ferramentas e recursos para maximizar a eficácia das suas estratégias de trading:
Ferramentas Avançadas de Gráficos: Personalize sua análise MACD com gráficos detalhados e sobreposições.
Seleção Diversificada de Ativos: Negocie forex, índices, commodities e mais, incluindo criptomoedas populares.
Execução Rápida: Experimente execução de ordens ultrarrápida para entradas e saídas otimizadas.
Recursos Educacionais: Acesse webinars, tutoriais e guias para aprimorar suas habilidades de trading.


