


Principais Conclusões:
Linhas de tendência são linhas diagonais traçadas através de máximas ou mínimas-chave que atuam como suportes e resistências dinâmicos em mercados como forex, criptomoedas, metais, ações e índices, ajudando traders de qualquer estilo, desde day trading até swing trading, a identificar rapidamente se o preço está em tendência de alta, baixa ou lateral, para que possam alinhar suas estratégias de CFDs com o momentum predominante.
As linhas de tendência ajudam traders em qualquer mercado a visualizar claramente se o preço está subindo, descendo ou se movimentando lateralmente, destacam níveis de suporte e resistência para entradas e saídas mais precisas, filtram flutuações ruidosas ao focar nas máximas e mínimas-chave e avaliam volatilidade e mudanças de momentum ao formar padrões gráficos como triângulos, canais e bandeiras.
Para traçar linhas de tendência eficazes, abra um gráfico limpo, use a ferramenta de linha de tendência para conectar pelo menos dois topos em uma tendência de baixa ou fundos em uma tendência de alta, estenda a linha para o futuro e ajuste-a até que toque três ou mais picos ou vales importantes, transformando-a em um guia forte para suportes, resistências e entradas futuras.
Linhas de tendência que conectam pelo menos três topos ou fundos são consideradas confirmadas, e quanto mais vezes o preço as retesta, mais fortes e confiáveis elas se tornam como suporte ou resistência.
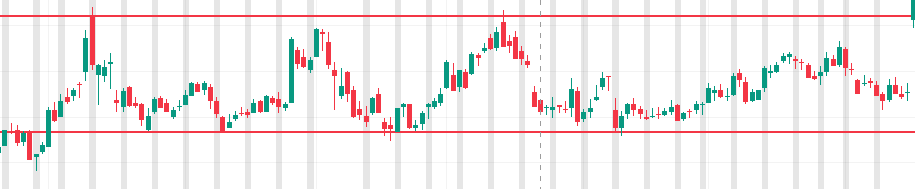
Os mercados se movimentam de três formas principais—tendência de alta (fundos ascendentes), tendência de baixa (topos descendentes) e faixas laterais—e os traders usam linhas de tendência não apenas para identificar essas tendências, mas também para aplicar estratégias como negociação em faixa e setups de rompimento de linha de tendência.
Negociação em faixa com linhas de tendência paralelas significa comprar próximo à linha inferior e vender próximo à linha superior, enquanto a negociação de rompimento com fechamentos fortes acima ou abaixo das linhas de tendência (frequentemente com volume maior) pode sinalizar movimentos poderosos de alta ou baixa.
Linhas de tendência são válidas somente quando conectam naturalmente pelo menos dois—idealmente três—topos ou fundos, ganham força com testes repetidos, enfraquecem quando muito inclinadas e devem sempre ser confirmadas com outros indicadores e contexto de mercado, em vez de serem forçadas em oscilações irregulares de preço.
O que é uma Linha de Tendência no trading?
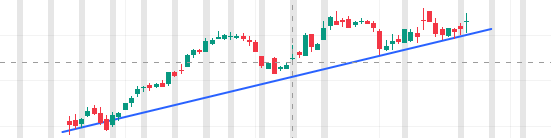
Linhas de tendência são linhas diagonais que traders desenham em gráficos de preço para mostrar a direção geral do movimento do preço, seja ele'ascendente, descendente ou lateral. Quando os preços estão em tendência de alta, linhas de tendência de alta são criadas conectando uma série de pontos baixos, mostrando claramente a tendência de alta em andamento.
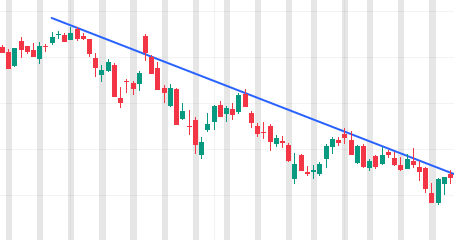
Por outro lado, linhas de tendência de baixa são formadas conectando uma série de pontos altos, revelando uma tendência descendente. Em mercados sem direção clara, linhas de tendência laterais podem ser desenhadas conectando várias máximas e mínimas, indicando um mercado sem tendência ou em movimento lateral. Uma característica importante das linhas de tendência é sua capacidade de funcionar como níveis de suporte e resistência, criando zonas onde os preços frequentemente rebatem ou potencialmente rompem, tornando-as ferramentas valiosas para prever o comportamento futuro do preço.
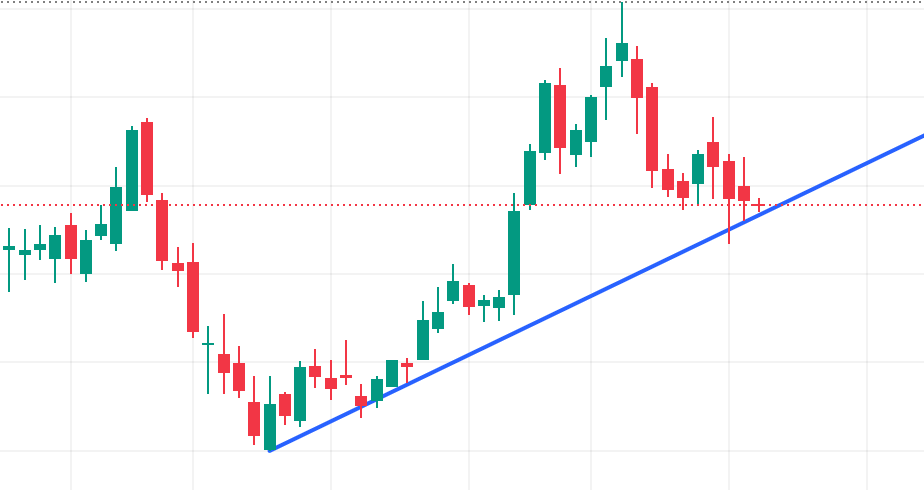
Linhas de tendência descendentes são traçadas a partir das máximas e inclinadas para baixo, sinalizando um viés baixista em mercados de forex, energias ou índices.
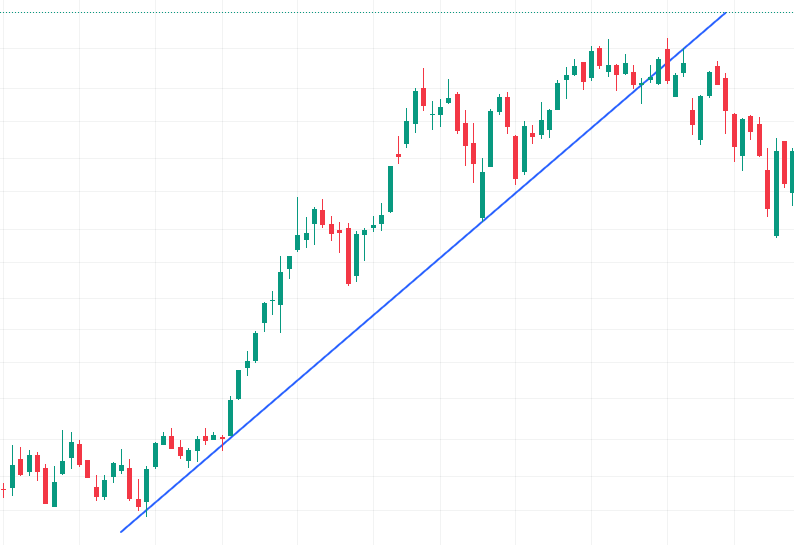
Linhas de tendência ascendentes conectam as mínimas e inclinadas para cima, indicando momentum de alta em criptomoedas, ações ou metais.
Seja você trader de forex, criptomoedas, metais, índices, ou pratique day trading, swing trading ou scalping, traçar uma linha simples através de máximas ou mínimas-chave revela instantaneamente a verdadeira direção do mercado’, filtrando o ruído para que você saiba quando o momentum está acelerando ou desacelerando.
Ao entender se o mercado está respeitando essas linhas de tendência, os traders podem alinhar estratégias de CFDs em criptomoedas, ouro ou índices acionários com a direção mais provável do movimento do preço.
Benefícios do Uso de Linhas de Tendência no Trading
Linhas de tendência oferecem vários benefícios práticos em todas as principais categorias de ativos:
Visualizar a tendência atual do movimento do preço: Elas proporcionam clareza visual sobre se os preços estão geralmente subindo, descendo ou se movimentando lateralmente. Útil para todos os tipos de mercados.
Identificação de níveis de suporte e resistência: Os preços frequentemente reagem em torno das linhas de tendência, oferecendo zonas claras para entradas e saídas.
Redução de ruído: A linha de tendência também ignora as flutuações menores dos movimentos de preço, focando apenas nos pontos mais altos e mais baixos para prever os próximos movimentos, reduzindo assim muito ruído, especialmente se o trader for influenciado por notícias e outras informações adicionais.
Avaliação da volatilidade: Traçar múltiplas linhas de tendência (por exemplo, uma acima e uma abaixo) pode revelar mudanças no comportamento do momentum atual ao formar triângulos, canais e bandeiras. Estes também são conhecidos como ‘Padrões Gráficos’.
Plataformas como MetaTrader 4 e MT5 permitem que você desenhe linhas de tendência manualmente ou conecte automaticamente máximas e mínimas em qualquer mercado, incluindo ouro, forex, criptomoedas ou gráficos de ações, permitindo que você aprenda efetivamente a desenhar linhas de tendência passo a passo.
Como desenhar Linhas de Tendência?
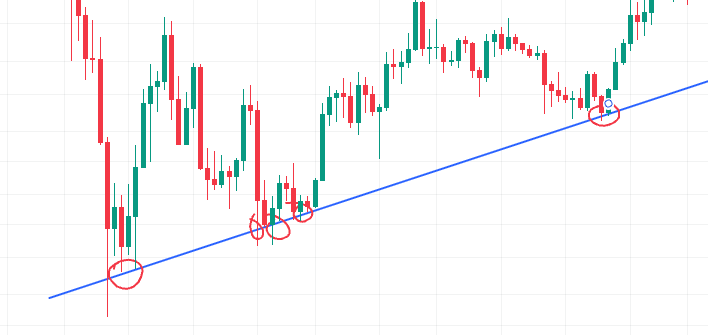
Para desenhar linhas de tendência, identifique no mínimo dois "pontos de oscilação" (topos para uma tendência de baixa ou fundos para uma tendência de alta) em um gráfico de preço, e então conecte-os com uma linha reta. Uma linha de tendência mais forte é formada conectando mais pontos sem que o preço atravesse a linha, e a linha deve ser estendida para o futuro para prever potenciais níveis de suporte ou resistência.
Usar linhas de tendência no trading frequentemente gera melhores resultados independentemente do mercado, como Ouro, Forex, Cripto, Commodities e Ações.
Siga os exemplos mostrados abaixo para desenhar linhas de tendência precisas e dominar a negociação com linhas de tendência:
Abra um gráfico limpo, sem indicadores, na sua plataforma de trading.
Identifique o ponto de preço mais alto ou mais baixo no gráfico. Suponha que você queira abrir uma posição de compra (long), deve procurar os pontos mais baixos e então desenhar uma linha de tendência para usá-la como nível de suporte, decidindo sua entrada com base nisso.
Para desenhar uma linha de tendência, você precisará encontrar a ferramenta de linha de tendência no gráfico que você’está usando. Normalmente, ela se parecerá com uma linha inclinada e pode ter uma descrição chamada ‘Trendline’.
Ajuste até que as linhas de tendência toquem pelo menos dois picos ou vales significativos—mínimo de três pontos para linhas de tendência fortes.
Nota Importante:
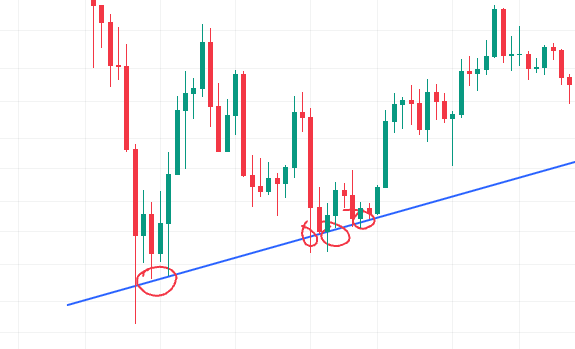
Linhas de tendência que são desenhadas com múltiplos pontos altos ou baixos consecutivos são consideradas ‘testadas várias vezes’. Essas linhas de tendência são consideradas como tendo a força da ‘confirmação’, e tendem a ser revisitadas pelo preço, proporcionando assim confiabilidade como nível de suporte ou resistência.
Portanto, uma linha de tendência válida em qualquer gráfico de preço e mercado, como ouro, forex, CFDs de criptomoedas ou outras classes de ativos, deve ter a boa prática de possuir pelo menos três pontos de oscilação. Quanto mais pontos de toque, mais forte é o sinal da linha de tendência.
Como Usar/Negociar com Linhas de Tendência
Tipos de Tendências
Existem três tipos de tendências:
Tendência de alta (fundos ascendentes)
Tendência de baixa (topos descendentes)
Tendência lateral (faixa)
Além de identificar tendências de alta e baixa, existem outras estratégias de negociação com linhas de tendência que profissionais utilizam, como Negociação em Faixa e Estratégia de Rompimento de Linha de Tendência.
Negociação em Faixa Usando Linhas de Tendência
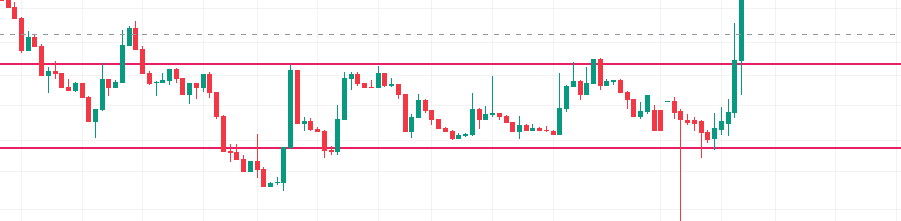
Negociação em faixa usando linhas de tendência inclui o uso de linhas paralelas para formar um canal, onde você pode:
Comprar (abrir posição long) próximo à linha de tendência inferior quando indicadores de alta confirmarem.
Vender (abrir posição short) próximo à linha de tendência superior quando sinais de baixa aparecerem.
Isso funciona igualmente bem em ouro, prata, energias e criptomoedas se você negociar CFDs nesses mercados, exemplificando estratégias com linhas de negociação.
Estratégias de Rompimento de Linha de Tendência
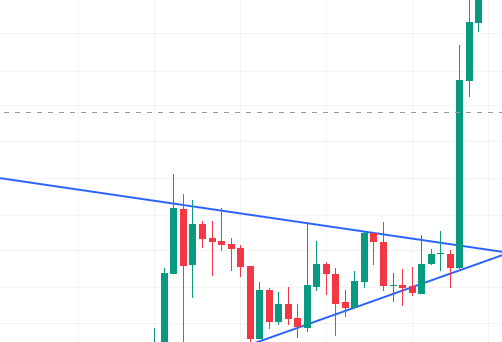
Rompimentos através das linhas de tendência podem desencadear movimentos fortes:
Um fechamento acima da linha de tendência superior—frequentemente com volume de negociação mais alto—sinaliza um rompimento de alta.
Um fechamento abaixo da linha de tendência inferior frequentemente indica um rompimento de baixa.
Abra posições longas ou curtas em CFDs de energias ou criptomoedas conforme o caso, usando linhas de tendência para cronometrar as entradas.
Considerações Importantes & Cuidados ao Negociar Tendências
Limitações
Os mercados se movem em oscilações irregulares, portanto uma linha de tendência isolada não confirma a direção e pode simplesmente refletir um contra-movimento ou consolidação.
Sempre valide linhas de tendência com confluência de indicadores e o contexto mais amplo nos índices, forex ou commodities antes de operar.
Considerações
Uma linha de tendência válida requer pelo menos dois topos ou fundos para ser desenhada, mas normalmente são necessários três toques para confirmá-la.
Quanto mais inclinada a linha de tendência, menos confiável ela tende a ser e maior a probabilidade de rompimento.
Assim como níveis horizontais de suporte e resistência, uma linha de tendência se torna mais significativa quanto mais vezes o preço a testa.
Mais importante, nunca force uma linha de tendência para se ajustar ao mercado; se ela não se alinhar naturalmente com a ação do preço, não deve ser considerada válida.
Aplicando Linhas de Tendência em Diferentes Mercados
Você pode aplicar linhas de tendência em praticamente qualquer mercado:
Índices (ex.: S&P 500, NASDAQ)
Principais e menores pares de Forex
Energias (ex.: petróleo bruto, gás natural)
Ações (CFDs sobre ações globais)
Metais (ouro, prata, platina)
Criptomoedas (Bitcoin, Ethereum, altcoins)
Os métodos de linhas de tendência são universais: os mesmos princípios orientam as linhas de tendência em gráficos de criptomoedas, metais ou ações.


