

Chainlink Price Forecast: LINK stalls near 200-day EMA following recent gains
- Chainlink price pauses gains near the 200-day EMA at $9.56, with the 61.8% Fibonacci retracement at $9.39 holding strong.
- Derivatives metrics show early signs of weakness, potentially limiting LINK’s upside.
- US-listed spot ETFs recorded an inflow of $2.07 million on Monday, marking their largest single-day inflow since July 22.
Chainlink (LINK) faces resistance near $9.56 on Tuesday and pauses gains after rallying over 14% last week. The cautious tone is supported by weakening derivatives metrics, suggesting bullish momentum may be losing steam. However, renewed demand from institutional investors hints LINK could push higher.

Derivatives traders show signs of weakness
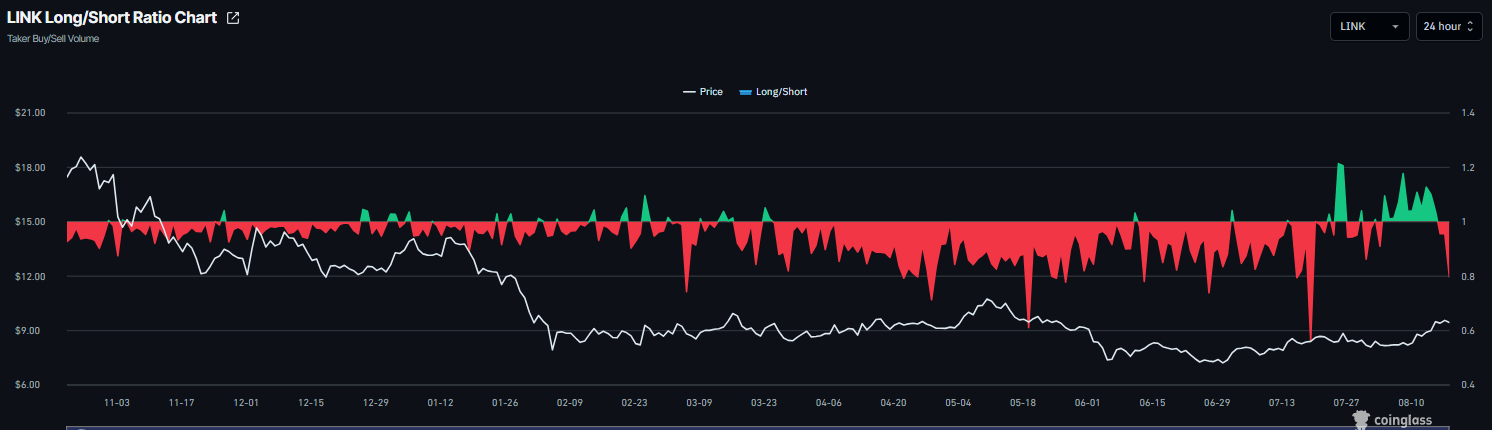
Derivatives data shows early signs of weakness and cautious sentiment among traders. CoinGlass’ long-to-short ratio for LINK reads 0.76 on Tuesday, nearing its lowest levels in a month. A ratio below one indicates bearish sentiment, as traders bet asset prices will fall.
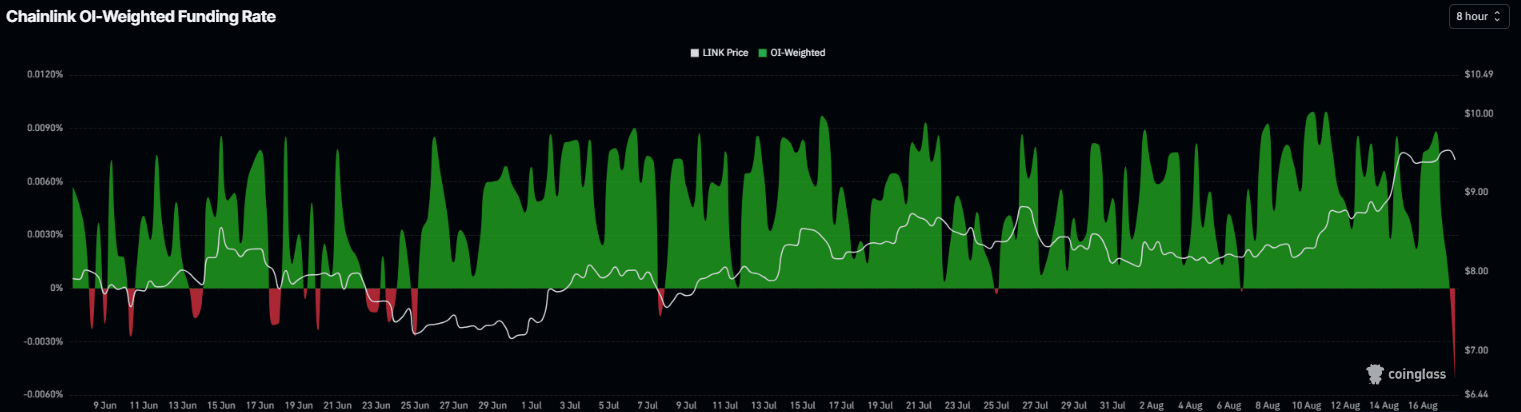
In addition, Chainlink’s funding rate flipped negative, reading -0.0050% on Tuesday. This negative rate indicates that short traders are paying longs and reflects a bearish bias.
Institutional demand remains strong
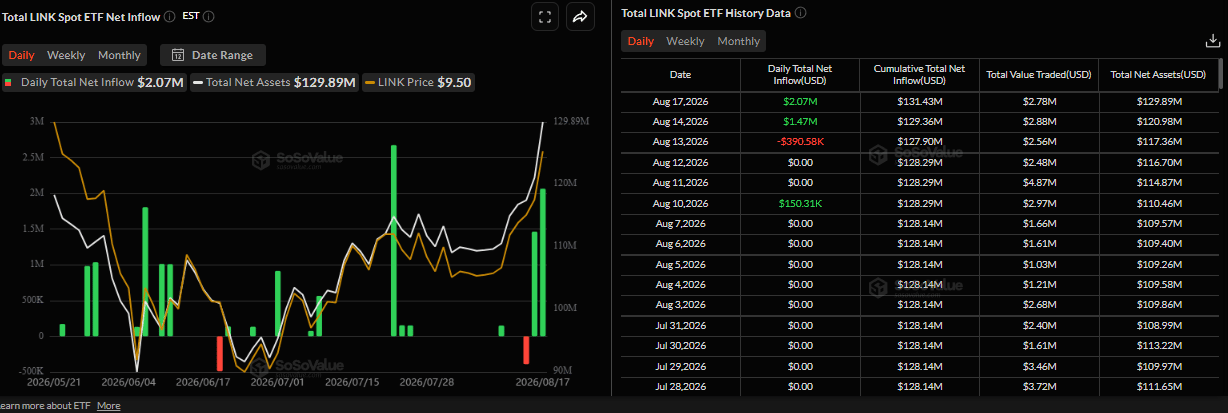
Institutional demand started the week on a positive note. SoSoValue data shows that spot LINK ETFs recorded an inflow of $2.07 million on Monday, marking its largest single-day inflow since July 22. If this trend continues and intensifies throughout the week, Chainlink could see a further rally.
Chainlink Price Forecast: LINK struggles near 200-day EMA
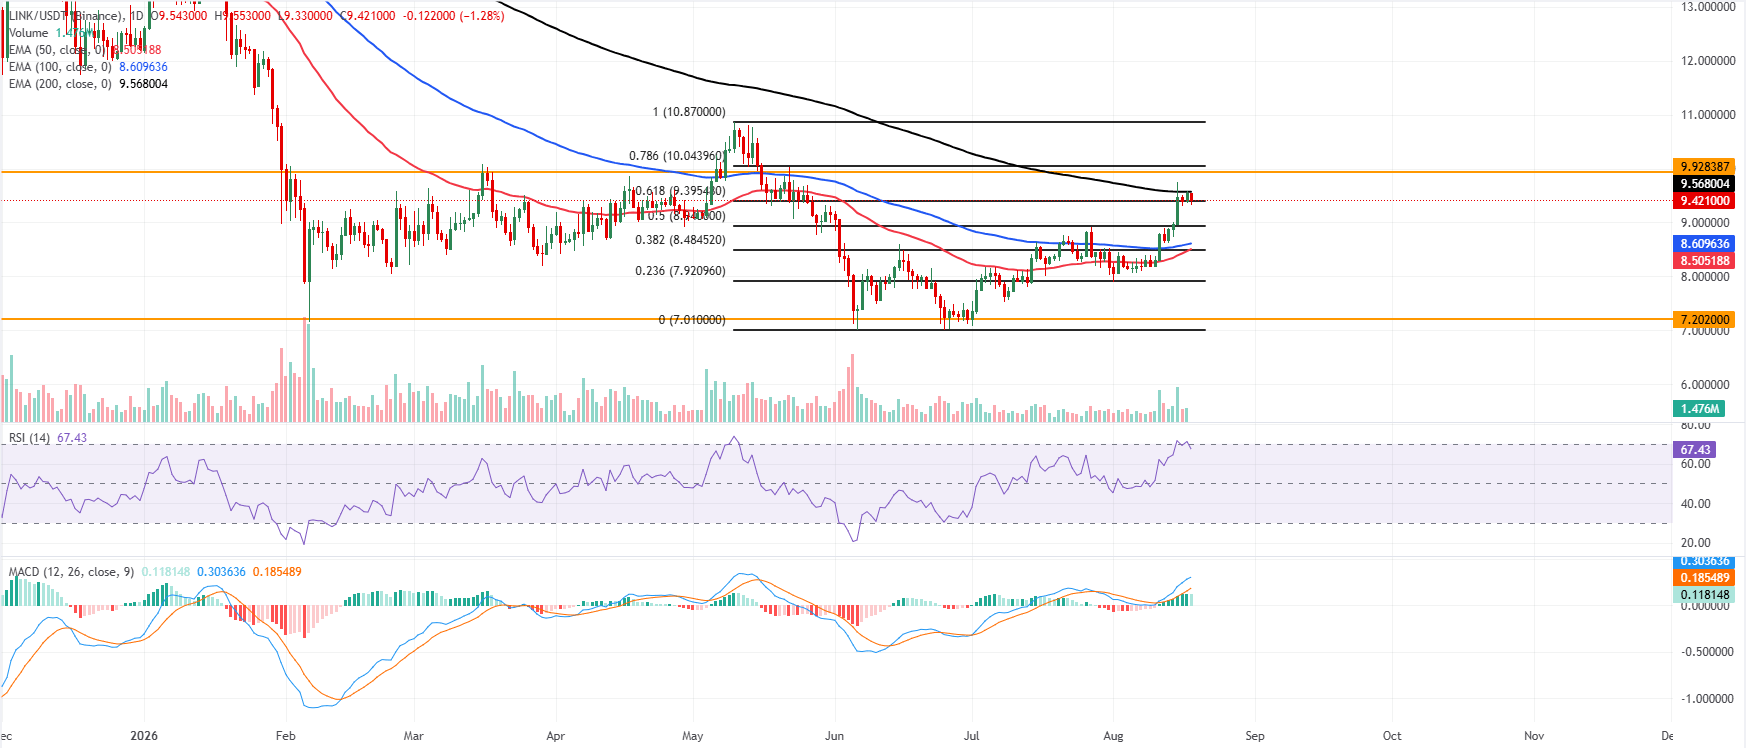
Chainlink price trades at $9.42 on Tuesday, holding above the 50-day and 100-day Exponential Moving Averages (EMAs) at $8.50 and $8.60, reinforcing a mildly constructive bias despite the pair still trading below the 200-day EMA at $9.56.
LINK has reclaimed the 61.8% Fibonacci retracement at $9.39 as immediate support. At the same time, the Relative Strength Index (RSI) at 67 sits just shy of overbought territory, and the Moving Average Convergence Divergence (MACD) remains positive, together suggesting that upside momentum is firm but approaching a potentially stretched zone.
On the downside, initial demand is seen at the 61.8% Fibonacci retracement at $9.39, followed by a broader support band around the 50% retracement level at $8.94 and the clustered 100-day and 50-day EMAs at $8.60 and $8.50, which underpin the medium-term floor.
On the topside, buyers face first resistance at the 200-day EMA at $9.56, ahead of the horizontal barrier at $9.92; a daily close above these caps would open the way toward the 78.6% Fibonacci retracement at $10.04, with the cycle high region near $10.87 remaining a distant bullish objective.
(The technical analysis of this story was written with the help of an AI tool. Know more.)













