
USD/CHF Price Forecast: Eyes 0.80 as inverse head-and-shoulders breakout holds
Por Christian Borjon Valencia
Atualizado: 9 Jun 2026


ARTIGOS POPULARES

The USD/CHF advances some 0.11% trades near nine-week highs of 0.7991 as risk aversion boosted the Greenback, which has trimmed some earlier losses, to challenge the 0.8000 figure.
- USD/CHF holds bullish bias after inverse head-and-shoulders neckline break.
- RSI flattens near 65, signaling buyers retain upside momentum.
- Break above 0.8000 exposes 0.8050 and 0.8100 resistance.
The USD/CHF advances some 0.11% trades near nine-week highs of 0.7991 as risk aversion boosted the Greenback, which has trimmed some earlier losses, to challenge the 0.8000 figure.
USD/CHF Price Forecast: Technical outlook
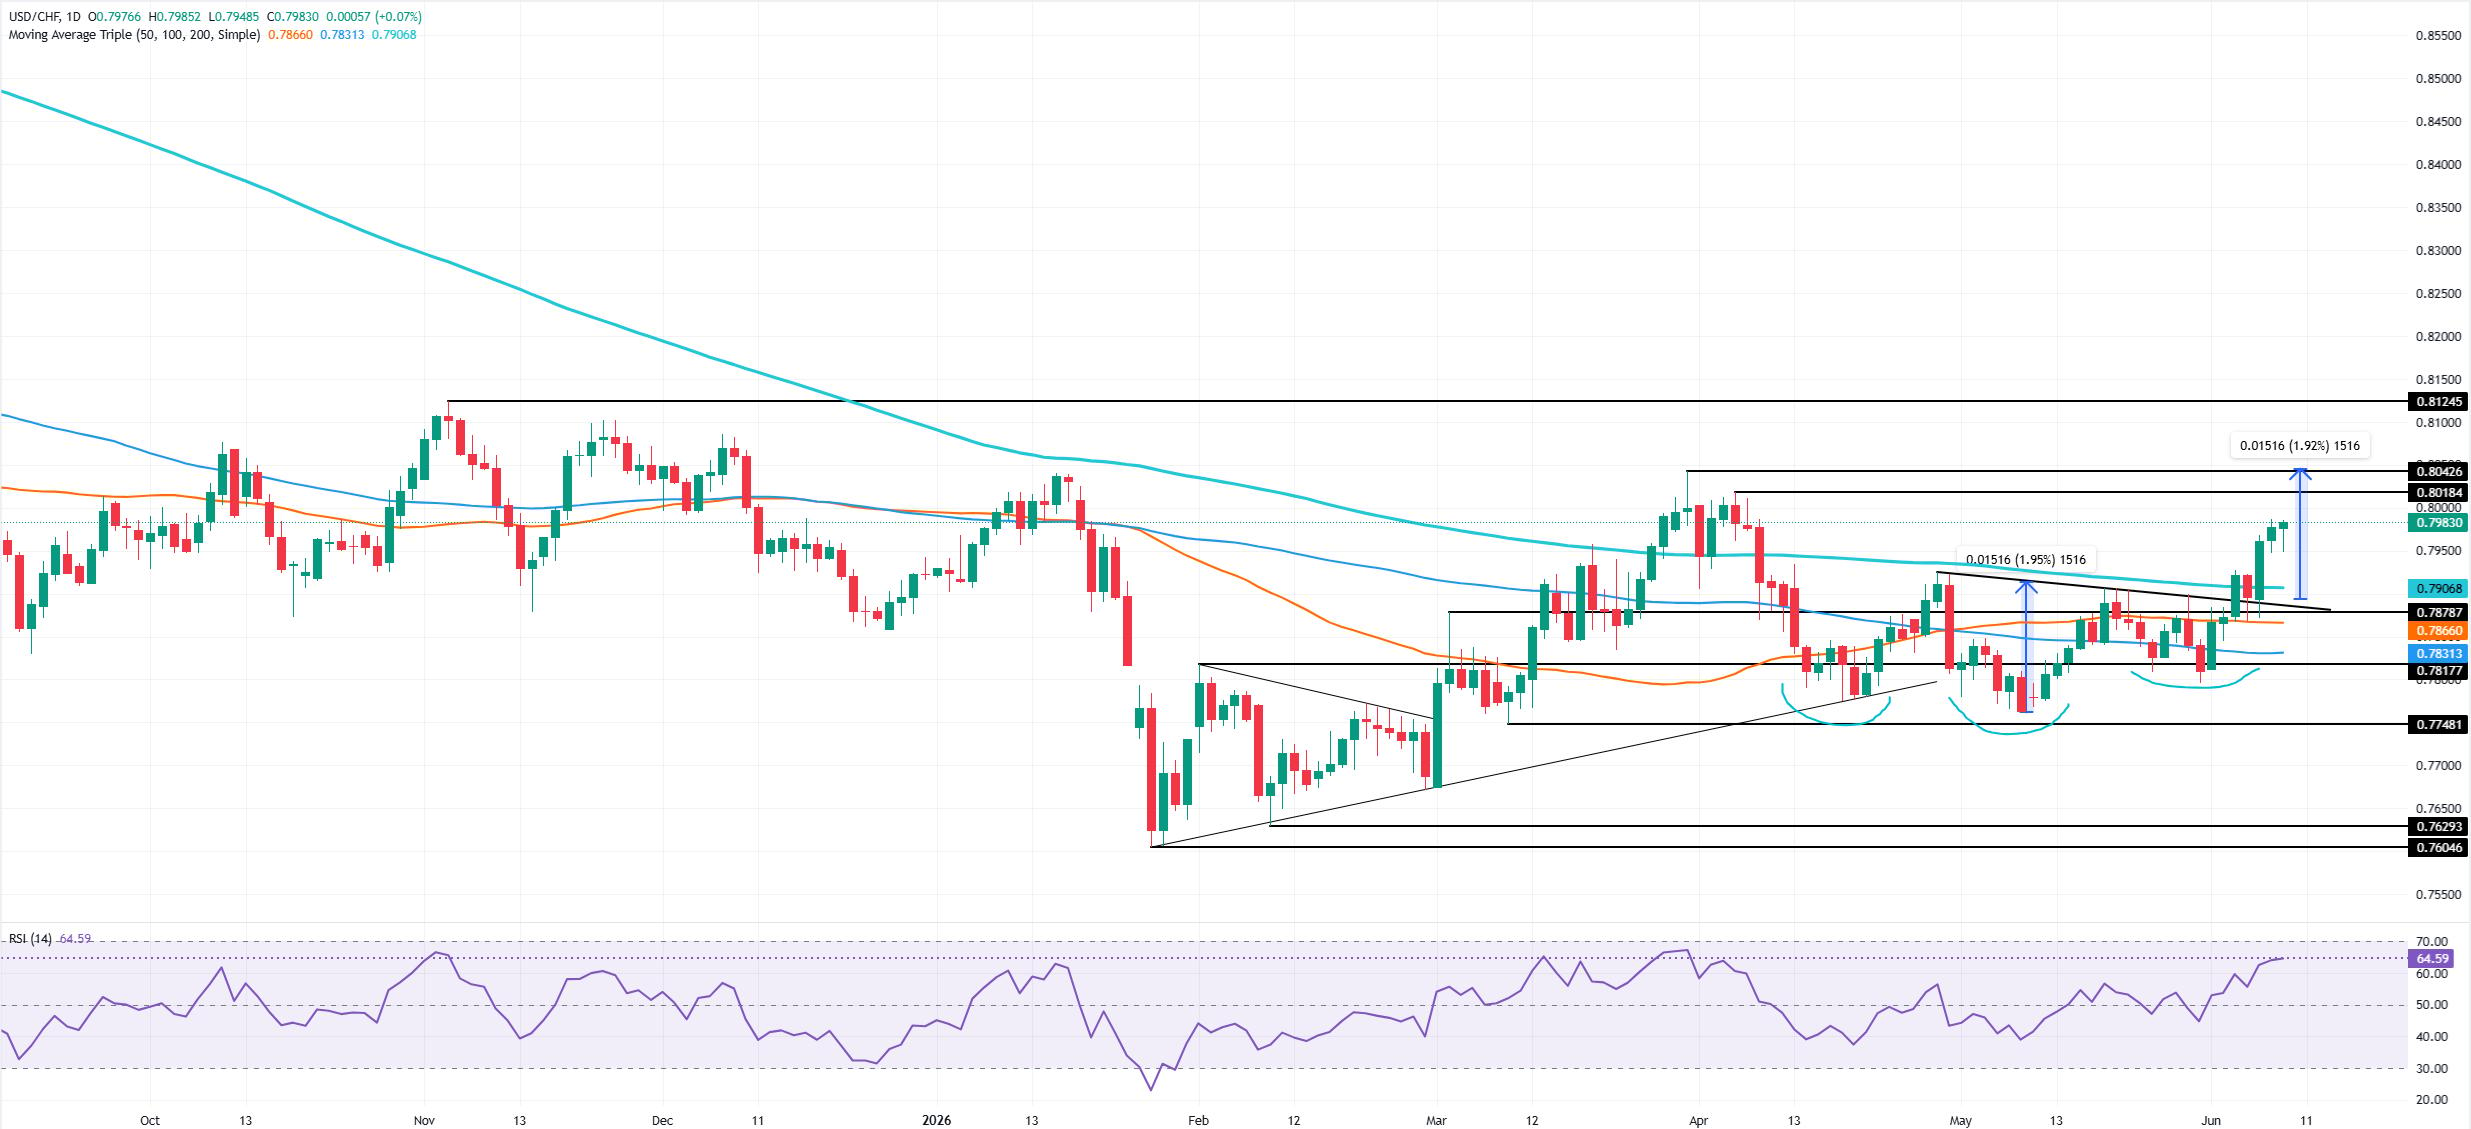
Price action shows the USD/CHF is bullish-biased after an ‘inverse head-and-shoulders’ was confirmed by a break of the neckline, which opened the door for further gains.
Momentum is also bullish, as shown by the Relative Strength Index (RSI), which turned flattish near the 65 level, suggesting that buyers are gathering momentum.
If USD/CHF climbs above 0.8000, the next stop would be the ‘inverse head-and-shoulders’ measured objective near the 0.8040-0.8050 area. A breach of the latter will expose the 0.8100 mark ahead of testing the November 5, 2025 swing high at 0.8124. Once those levels are hurdled, 0.8200 is up next.
Downwards, the first support is the June 5 daily high at 0.7968. Below this level lies 0.7950 ahead of the 200-day Simple Moving Average (SMA) at 0.7907.
USD/CHF Price Chart – Daily
Swiss Franc Price Today
The table below shows the percentage change of Swiss Franc (CHF) against listed major currencies today. Swiss Franc was the strongest against the Australian Dollar.
| USD | EUR | GBP | JPY | CAD | AUD | NZD | CHF | |
|---|---|---|---|---|---|---|---|---|
| USD | -0.09% | -0.31% | 0.13% | -0.05% | 0.21% | -0.12% | 0.05% | |
| EUR | 0.09% | -0.20% | 0.22% | 0.03% | 0.35% | 0.00% | 0.17% | |
| GBP | 0.31% | 0.20% | 0.43% | 0.25% | 0.52% | 0.21% | 0.37% | |
| JPY | -0.13% | -0.22% | -0.43% | -0.17% | 0.09% | -0.22% | -0.06% | |
| CAD | 0.05% | -0.03% | -0.25% | 0.17% | 0.27% | -0.04% | 0.12% | |
| AUD | -0.21% | -0.35% | -0.52% | -0.09% | -0.27% | -0.31% | -0.16% | |
| NZD | 0.12% | -0.01% | -0.21% | 0.22% | 0.04% | 0.31% | 0.15% | |
| CHF | -0.05% | -0.17% | -0.37% | 0.06% | -0.12% | 0.16% | -0.15% |
The heat map shows percentage changes of major currencies against each other. The base currency is picked from the left column, while the quote currency is picked from the top row. For example, if you pick the Swiss Franc from the left column and move along the horizontal line to the US Dollar, the percentage change displayed in the box will represent CHF (base)/USD (quote).

Mais de um milhão de usuários confiam na FXStreet para dados de mercado em tempo real, ferramentas de gráficos, insights de especialistas e notícias de Forex. Seu calendário econômico abrangente e webinars educacionais ajudam os traders a se manterem informados e tomarem decisões calculadas. A FXStreet conta com uma equipe de cerca de 60 profissionais, divididos entre a sede em Barcelona e diversas regiões globais.
Ler mais


