
Bitcoin Weekly Forecast: Market structure shifts to bullish
โดย Manish Chhetri
อัปเดตแล้ว: 24 Apr 2026


บทความยอดนิยม

Bitcoin (BTC) looks set for a fourth consecutive week of gains, hinting at a bullish market structure as it faces resistance at the $80,000 psychological level.
- Bitcoin looks set for a fourth consecutive week of gains despite lingering uncertainty from the Iran war.
- US-listed spot ETFs continue to highlight strong institutional demand for Bitcoin.
- Strategy’s stock price surges alongside BTC’s recovery as its average buying price stands below current market prices.
Bitcoin (BTC) looks set for a fourth consecutive week of gains, hinting at a bullish market structure as it faces resistance at the $80,000 psychological level. The outlook for the largest crypto asset has improved recently, with robust institutional demand for spot Exchange Traded Funds (ETFs) and the Strategy’s continuous accumulation supporting the Crypto King, which has proven its resilience amid the continuous uncertainty stemming from the Iran war.
The comeback of institutional investors
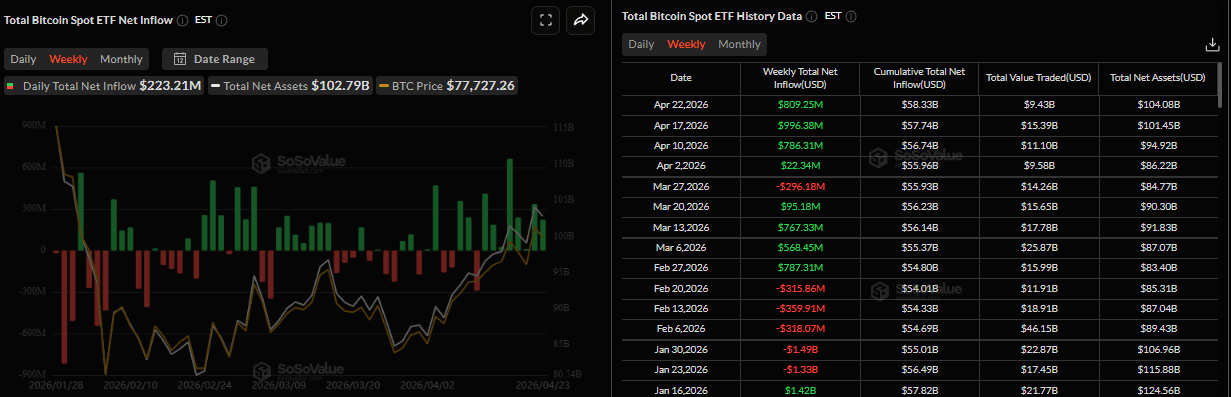
Institutional investors have supported Bitcoin’s price, which has continued to rise this week. SoSoValue data show that spot Bitcoin ETFs have recorded a net inflow of $809.25 million through Thursday. If this trend continues on Friday, it will mark the fourth consecutive week of inflows. In case these inflows keep coming in and intensify, BTC could see a further rally ahead.
Bitcoin price surge lifts Strategy stock price
On the corporate side, Michael Saylor announced on X on Monday that his firm, Strategy (MSTR), had purchased another 34,164 BTC for $2.54 billion. The firm continues with its aggressive accumulation spree, despite the geopolitical conflict and the $14.46 billion unrealized loss on its Bitcoin holdings for Q1. Strategy's total holdings stand currently at 815,061 BTC.
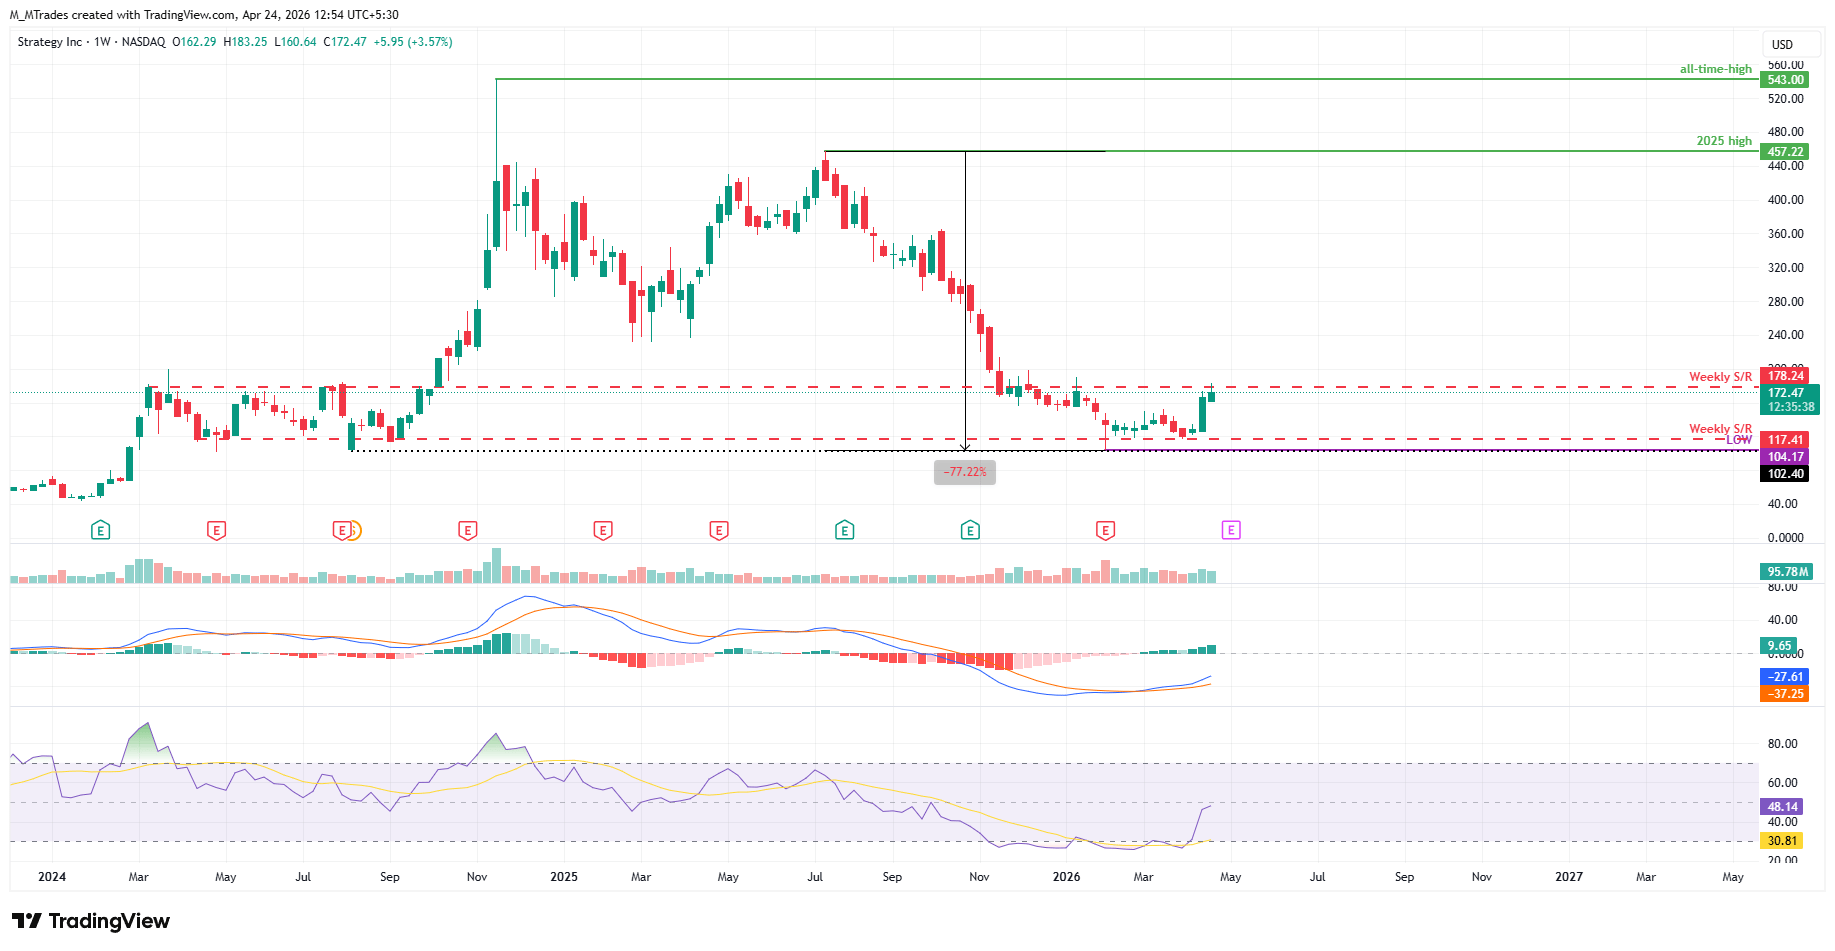
With Bitcoin reaching a weekly high of $79,472, its highest level since early February, Strategy’s (MSTR) average purchase price across its Bitcoin holdings stands at $75,527, back below BTC’s current market price. This has strengthened investor confidence in the company, helping MSTR stock climb to $183.25 this week, its highest level since mid-January (see chart below). If BTC continues to surge, MSTR’s stock price could rally as well.
Liquidity injection could boost BTC
According to Barchart’s X post on Tuesday, the US Treasury is projected to buy back $15 billion of its own debt — matching the largest Treasury buyback in history. This move could inject additional liquidity into the markets, which is bullish for Bitcoin because it is a highly liquidity-driven asset.
Iran conflict and Hormuz blockade still weighs on risk sentiment
Besides strong institutional and corporate demand, and possible liquidity injections from Treasury buybacks, the Middle East’s continued uncertainty could cap short-term risk sentiment among market participants.
Iran fired on three ships in the Strait of Hormuz and escorted two of them to Iranian waters, the Wall Street Journal reported on Wednesday. The attacks came a day after US President Donald Trump extended a ceasefire while maintaining an American blockade of Iranian ports.
In addition, the signs of friction between the US and Iran remain due to the American naval blockade of Iranian ports. In fact, Iran’s Foreign Minister, Abbas Araghchi, called the blockade an act of war. Moreover, Iran’s chief negotiator, Mohammad Bagher Ghalibaf, said that a complete ceasefire only makes sense if it is not violated by the maritime blockade. Meanwhile, US President Donald Trump ordered the US Navy to shoot and kill any boat laying mines in the critical shipping channel.
These headlines dampened hopes for a durable de-escalation and continue to hinder short-term risk sentiment, with risk-sensitive assets such as Bitcoin (BTC) pausing their recent price surge.
The next key hurdle is the $80,000 mark
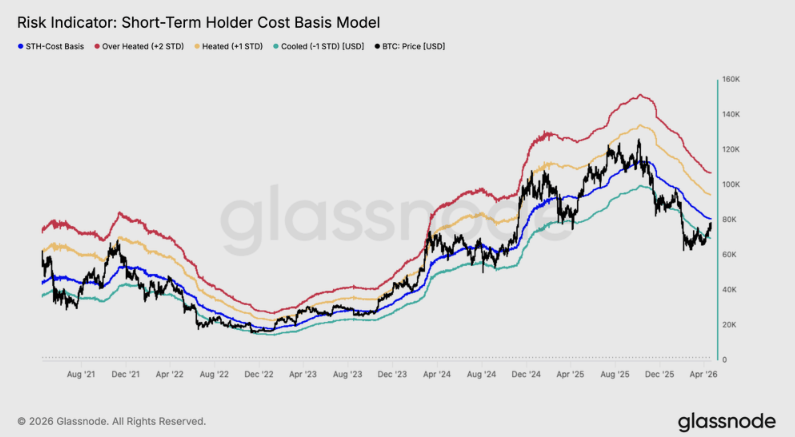
Glassnode's weekly report highlights that BTC’s move back above the True Market Mean marks an important shift in market structure, with price reclaiming a key cost basis level that often defines the boundary between bearish and constructive regimes.
“This recovery is now being supported by improving spot demand and a tentative return of ETF inflows, suggesting that both retail and institutional participation are beginning to re-engage. At the same time, derivatives positioning paints a more cautious picture,” the report said.
“The market appears to be transitioning into a more constructive phase, but one that still requires confirmation. A sustained push through the $80K level would likely depend on continued spot absorption and consistent ETF demand, while failure to hold current levels could see downside moves accelerate given the relatively thin liquidity environment,” Glassnode’s analyst concludes.
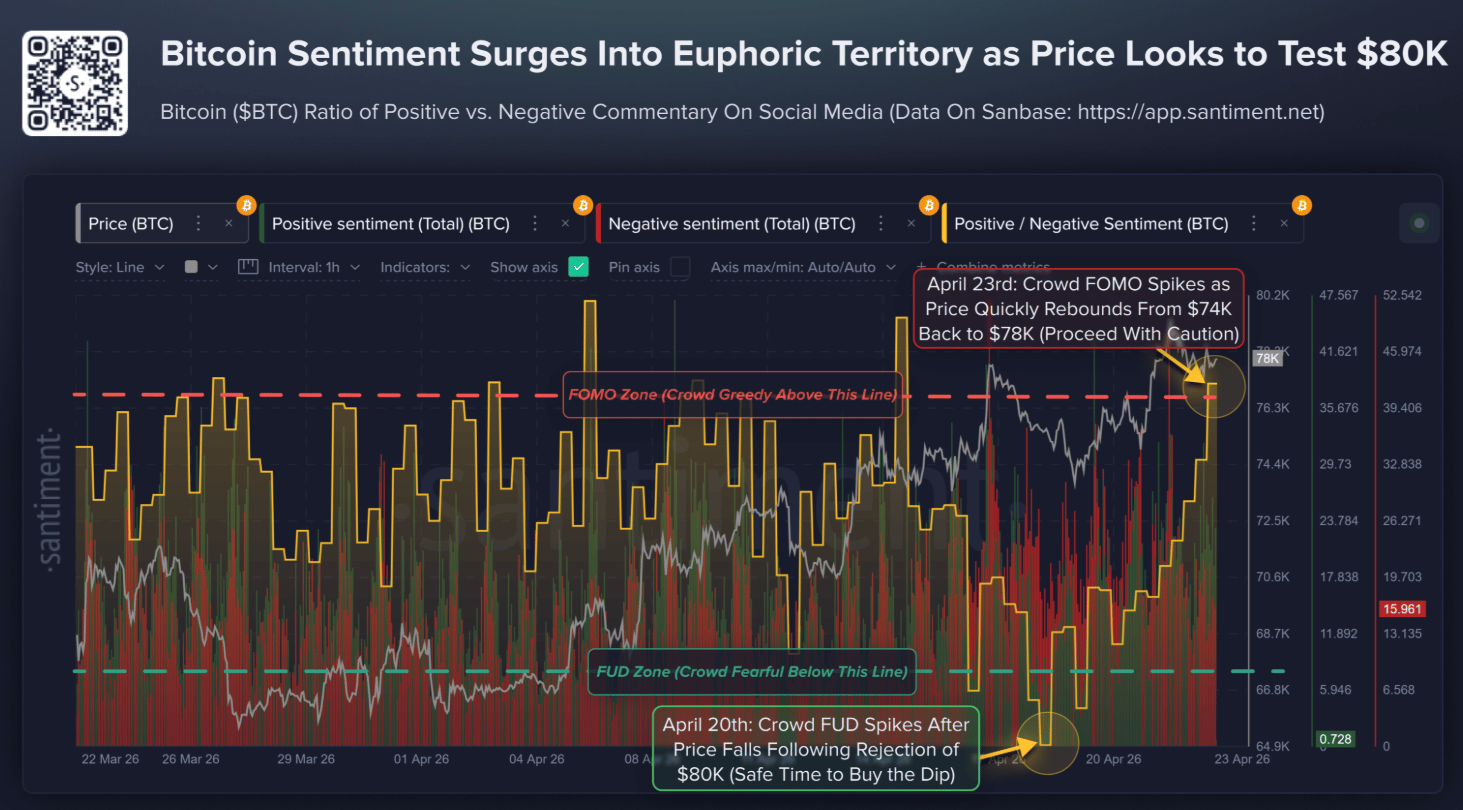
On another note, Santiment data highlights a sharp shift in Bitcoin market sentiment, with the Crypto King’s crowd moving from extreme pessimism on Monday to strong Fear of Missing Out (FOMO) by Thursday.
The chart below shows that after BTC looked set for a deeper correction following its rejection near $80,000, prices quickly rebounded above $78,000, flipping sentiment sharply bullish. This rising crowd FOMO is flashing a caution signal.
While a breakout above $80,000 could trigger a stronger rally and attract new and returning traders, Santiment analyst note that such a move would be healthier if optimism cools slightly first, as markets often move against crowd expectations.
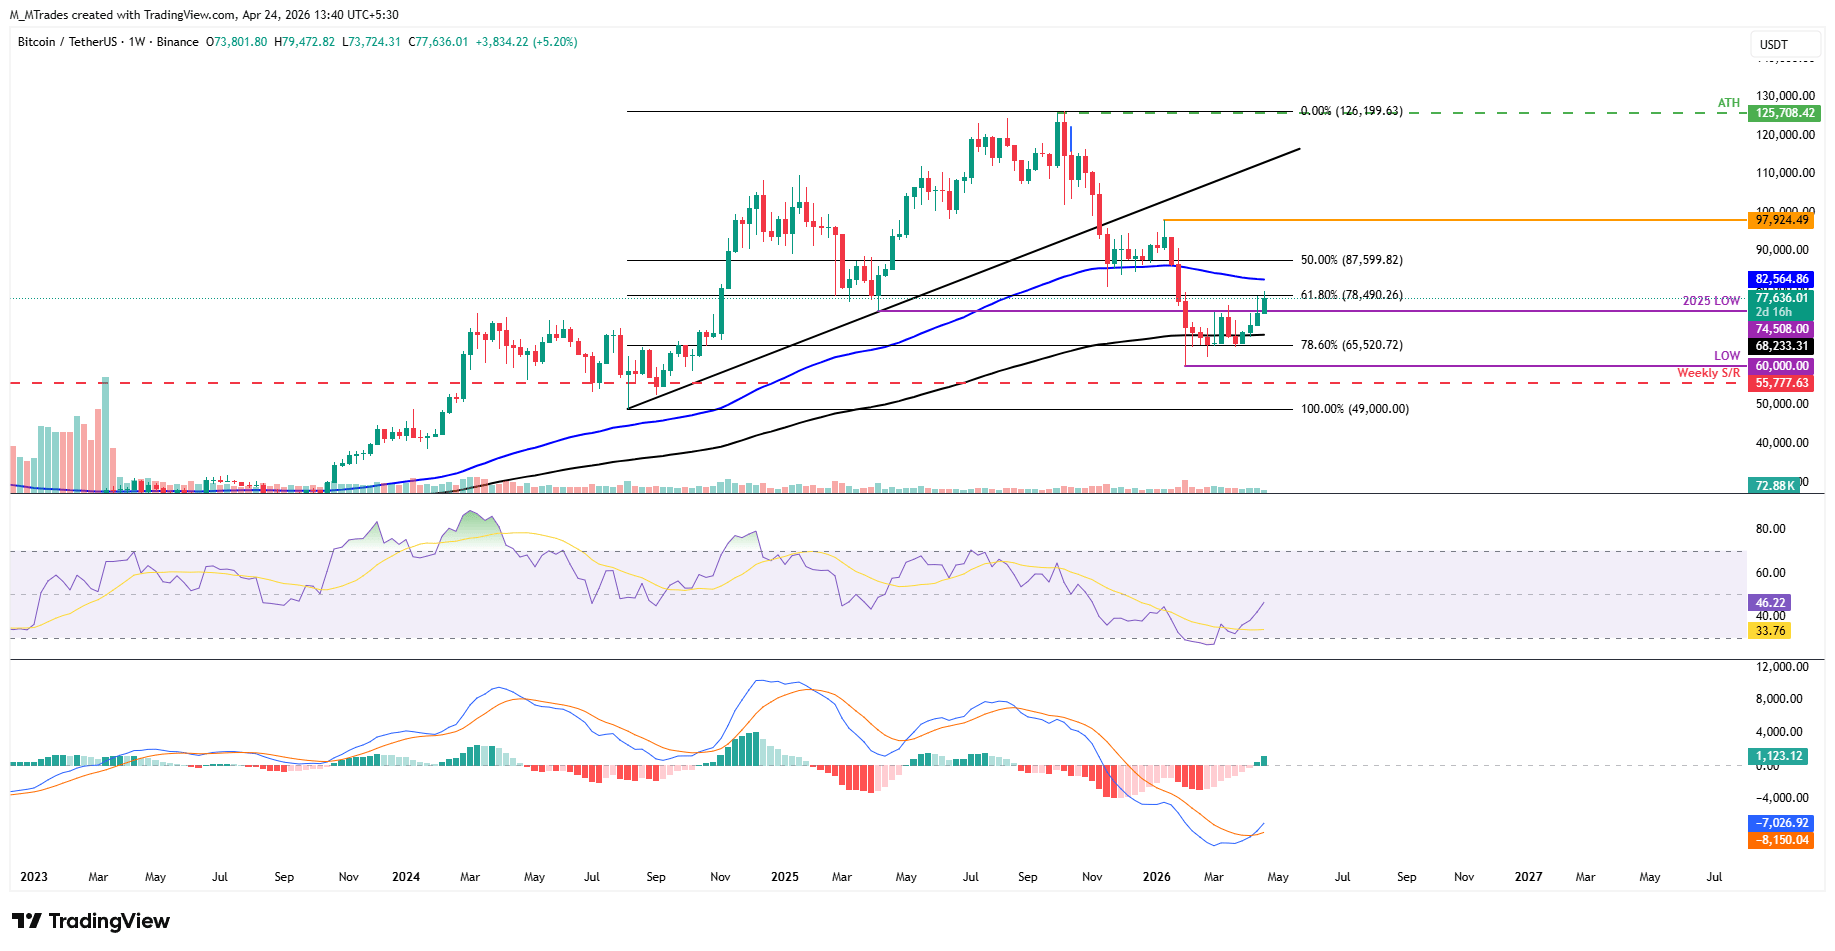
Bitcoin technical outlook: Price action looks constructive
The Crypto King rose by more than 5% so far this week, surpassing the February high and inching closer to the $80,000 mark.
If BTC continues its upward move, it could extend the rally toward the 61.8% Fibonacci retracement level at $78,490 (drawn from the August 2024 low of $49,000 to the October 2025 all-time high of $126,199). A successful close above this level could extend gains toward the $80,000 psychological hurdle, and then toward the 200-week Exponential Moving Average (EMA) at $82,564.
The Relative Strength Index (RSI) reads 46 on the weekly chart, pointing upward toward the neutral level of 50 after recovering from oversold territory, indicating fading bearish momentum. The Moving Average Convergence Divergence (MACD) indicator on the same chart showed a bullish crossover last week, with a positive histogram supporting the bullish thesis.
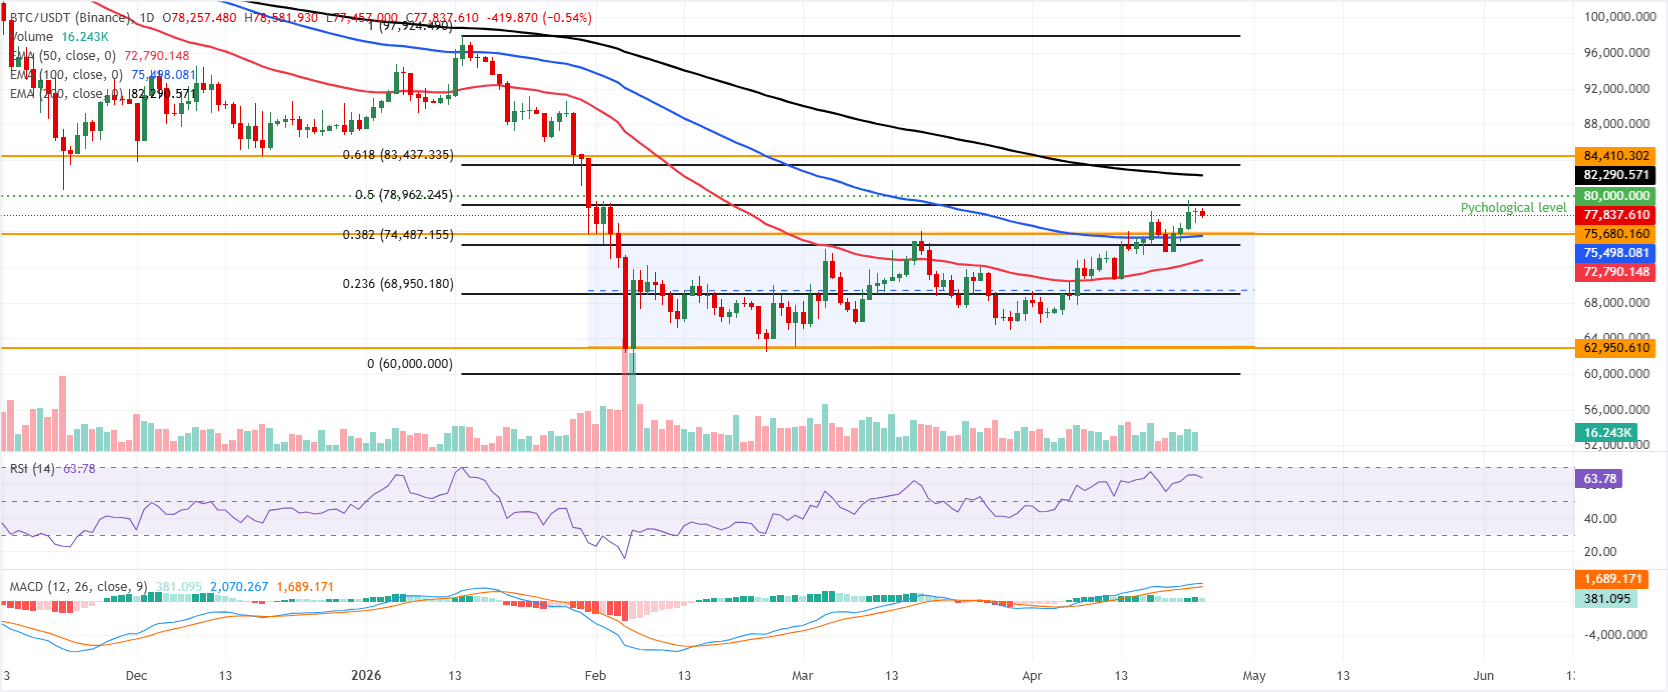
The daily chart also maintains a constructive bullish bias as price holds well above the 50-day and 100-day EMAs at $72,790 and $75,498, respectively. Price is also stretching away from the upper boundary of the horizontal parallel channel at around $75,680, hinting at persistent upside pressure after the recent breakout.
Momentum supports the topside tone, with the RSI on the daily chart hovering near 63 (in bullish territory without being overbought) and the MACD staying positive, suggesting buyers retain control.
On the topside, immediate resistance is located at the 50% retracement (drawn from the January high to the February low) near $78,962, followed by the psychological $80,000 mark. Above that area, the 200-day EMA at $82,290 and the 61.8% Fibonacci retracement around $83,437 form a thicker barrier ahead of horizontal resistance near $84,410.
On the downside, initial support is seen around the prior channel top at $75,680, reinforced by the nearby 100-day EMA at $75,498. A deeper pullback would expose the 38.2% retracement around $74,487, with the 50-day EMA at $72,790 and the 23.6% retracement near $68,950 acting as subsequent layers of demand.
(The technical analysis of this story was written with the help of an AI tool.)
Bitcoin, altcoins, stablecoins FAQs
Bitcoin is the largest cryptocurrency by market capitalization, a virtual currency designed to serve as money. This form of payment cannot be controlled by any one person, group, or entity, which eliminates the need for third-party participation during financial transactions.
Altcoins are any cryptocurrency apart from Bitcoin, but some also regard Ethereum as a non-altcoin because it is from these two cryptocurrencies that forking happens. If this is true, then Litecoin is the first altcoin, forked from the Bitcoin protocol and, therefore, an “improved” version of it.
Stablecoins are cryptocurrencies designed to have a stable price, with their value backed by a reserve of the asset it represents. To achieve this, the value of any one stablecoin is pegged to a commodity or financial instrument, such as the US Dollar (USD), with its supply regulated by an algorithm or demand. The main goal of stablecoins is to provide an on/off-ramp for investors willing to trade and invest in cryptocurrencies. Stablecoins also allow investors to store value since cryptocurrencies, in general, are subject to volatility.
Bitcoin dominance is the ratio of Bitcoin's market capitalization to the total market capitalization of all cryptocurrencies combined. It provides a clear picture of Bitcoin’s interest among investors. A high BTC dominance typically happens before and during a bull run, in which investors resort to investing in relatively stable and high market capitalization cryptocurrency like Bitcoin. A drop in BTC dominance usually means that investors are moving their capital and/or profits to altcoins in a quest for higher returns, which usually triggers an explosion of altcoin rallies.

ผู้ใช้กว่าหนึ่งล้านคนพึ่งพา FXStreet สำหรับข้อมูลตลาดเรียลไทม์ เครื่องมือกราฟ การวิเคราะห์จากผู้เชี่ยวชาญ และข่าวฟอเร็กซ์ ปฏิทินเศรษฐกิจที่ครอบคลุมและเว็บบินาร์การศึกษาช่วยให้เทรดเดอร์ทันเหตุการณ์และตัดสินใจอย่างรอบคอบ FXStreet มีทีมงานประมาณ 60 คน แบ่งระหว่างสำนักงานใหญ่บาร์เซโลนาและภูมิภาคต่าง ๆ ทั่วโลก
อ่านเพิ่มเติม


