
Crypto Today: Bitcoin, Ethereum, XRP face downside pressure amid investor de-risking
โดย John Isige
อัปเดตแล้ว: 10 Jun 2026


บทความยอดนิยม

Major crypto assets trade under intense headwinds on Wednesday, as market participants navigate complex geopolitical and macroeconomic environments. Bitcoin (BTC) has slipped toward $61,000 after its recent rebound was sold near $64,000, leaving buyers exhausted.
- Bitcoin slides and holds $61,000 as spot ETFs keep recording outflows.
- Ethereum accelerates its decline toward $1,600 amid persistent risk-averse sentiment.
- XRP extends correction for the second consecutive day, testing support at $1.10, while pressured by deteriorating momentum indicators.
Major crypto assets trade under intense headwinds on Wednesday, as market participants navigate complex geopolitical and macroeconomic environments. Bitcoin (BTC) has slipped toward $61,000 after its recent rebound was sold near $64,000, leaving buyers exhausted.
Altcoins, including Ethereum (ETH) and Ripple (XRP), mirror Bitcoin’s bearish outlook, trading around $1,600 and $1.10, respectively.
Bitcoin and Ethereum face capital outflows amid Middle East tensions
Geopolitical tensions in the Middle East continue to run high, with the United States (US) Central Command announcing late Tuesday that it had carried out retaliatory strikes against Iran after an American helicopter was downed earlier in the week. Axios reports that these operations are targeting Iranian air defense and radar installations in southern Iran.
The Islamic Revolutionary Guard Corps (IRGC) of Iran has signaled its readiness to deliver a decisive response to any additional US military action, further escalating regional uncertainty. The IRGC also claimed responsibility for drone strikes targeting the Ali Al Salem Air Base in Kuwait, adding to geopolitical risks that continue to weigh on crypto market sentiment.
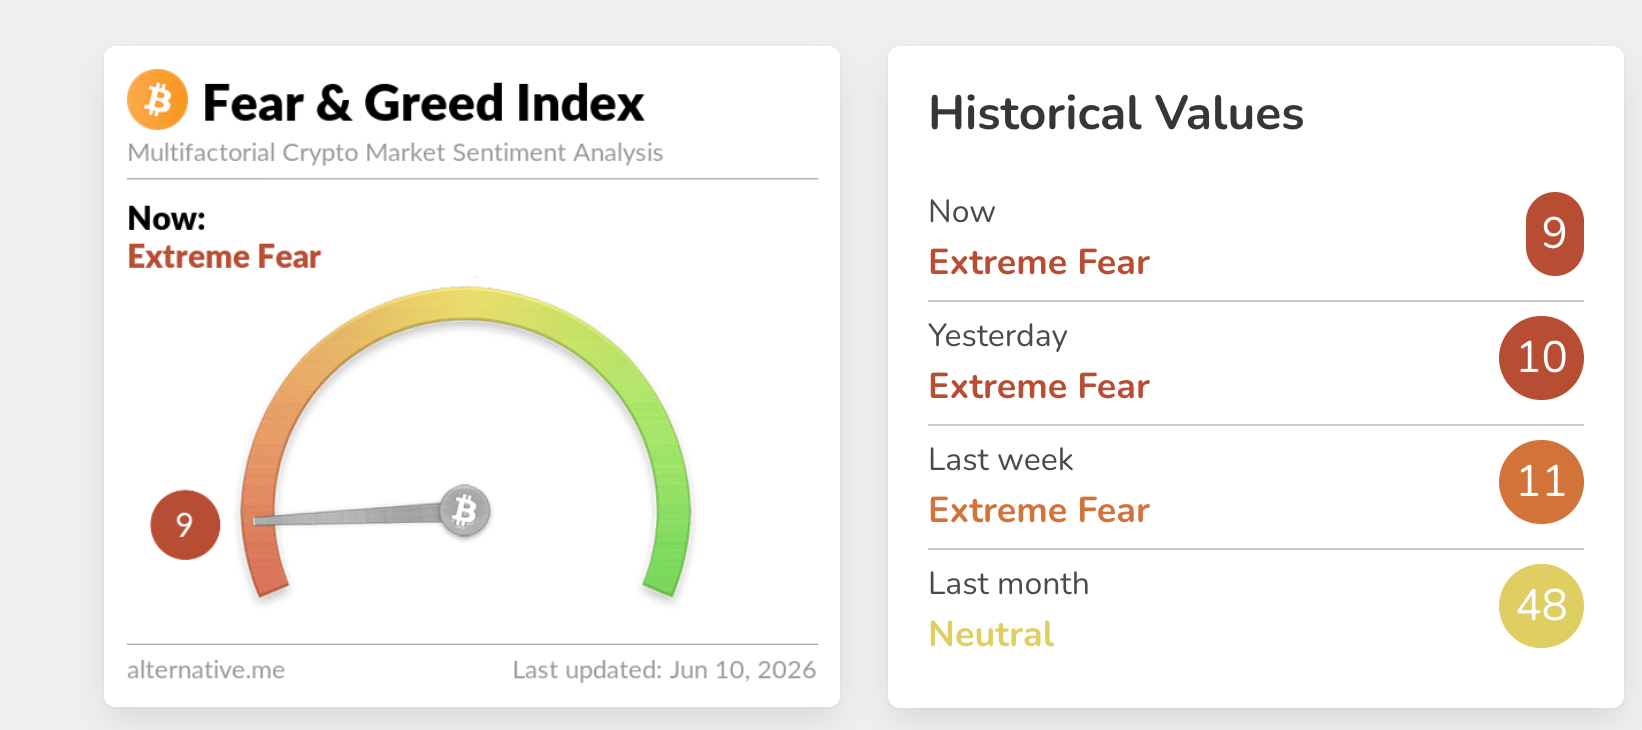
Risk assets are on the edge amid the complex geopolitical environment, as reflected in the crypto Fear & Greed Index, which holds at 9 in the Extreme Fear territory on Wednesday, down from 10 the day before. Incessant risk-off sentiment could continue to limit the crypto market’s broader recovery, keeping investors on the sidelines.
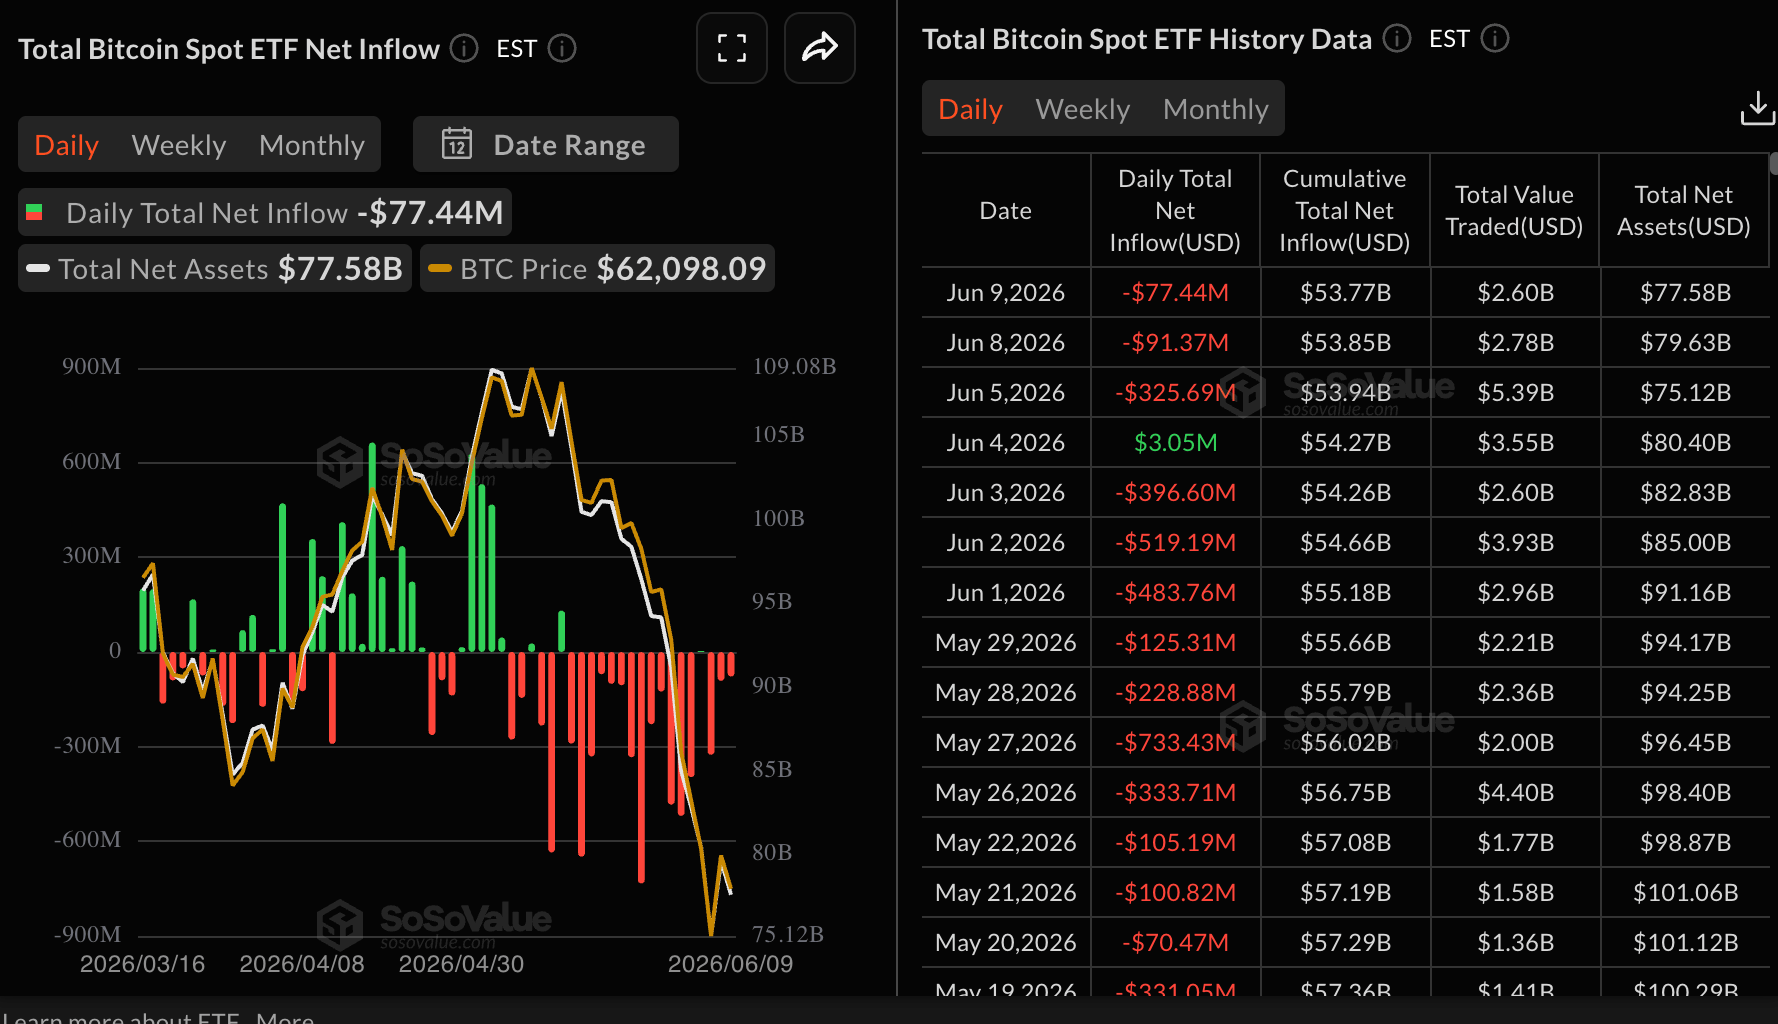
Outflows from Bitcoin spot Exchange-Traded Funds (ETFs) continued on Tuesday, amounting to roughly $77 million, according to SoSoValue data. That marks the third consecutive day of outflows, bringing cumulative inflows to $53.77 billion and net assets under management to $77.58 billion. Continued outflows suggest that risk appetite is nonexistent.
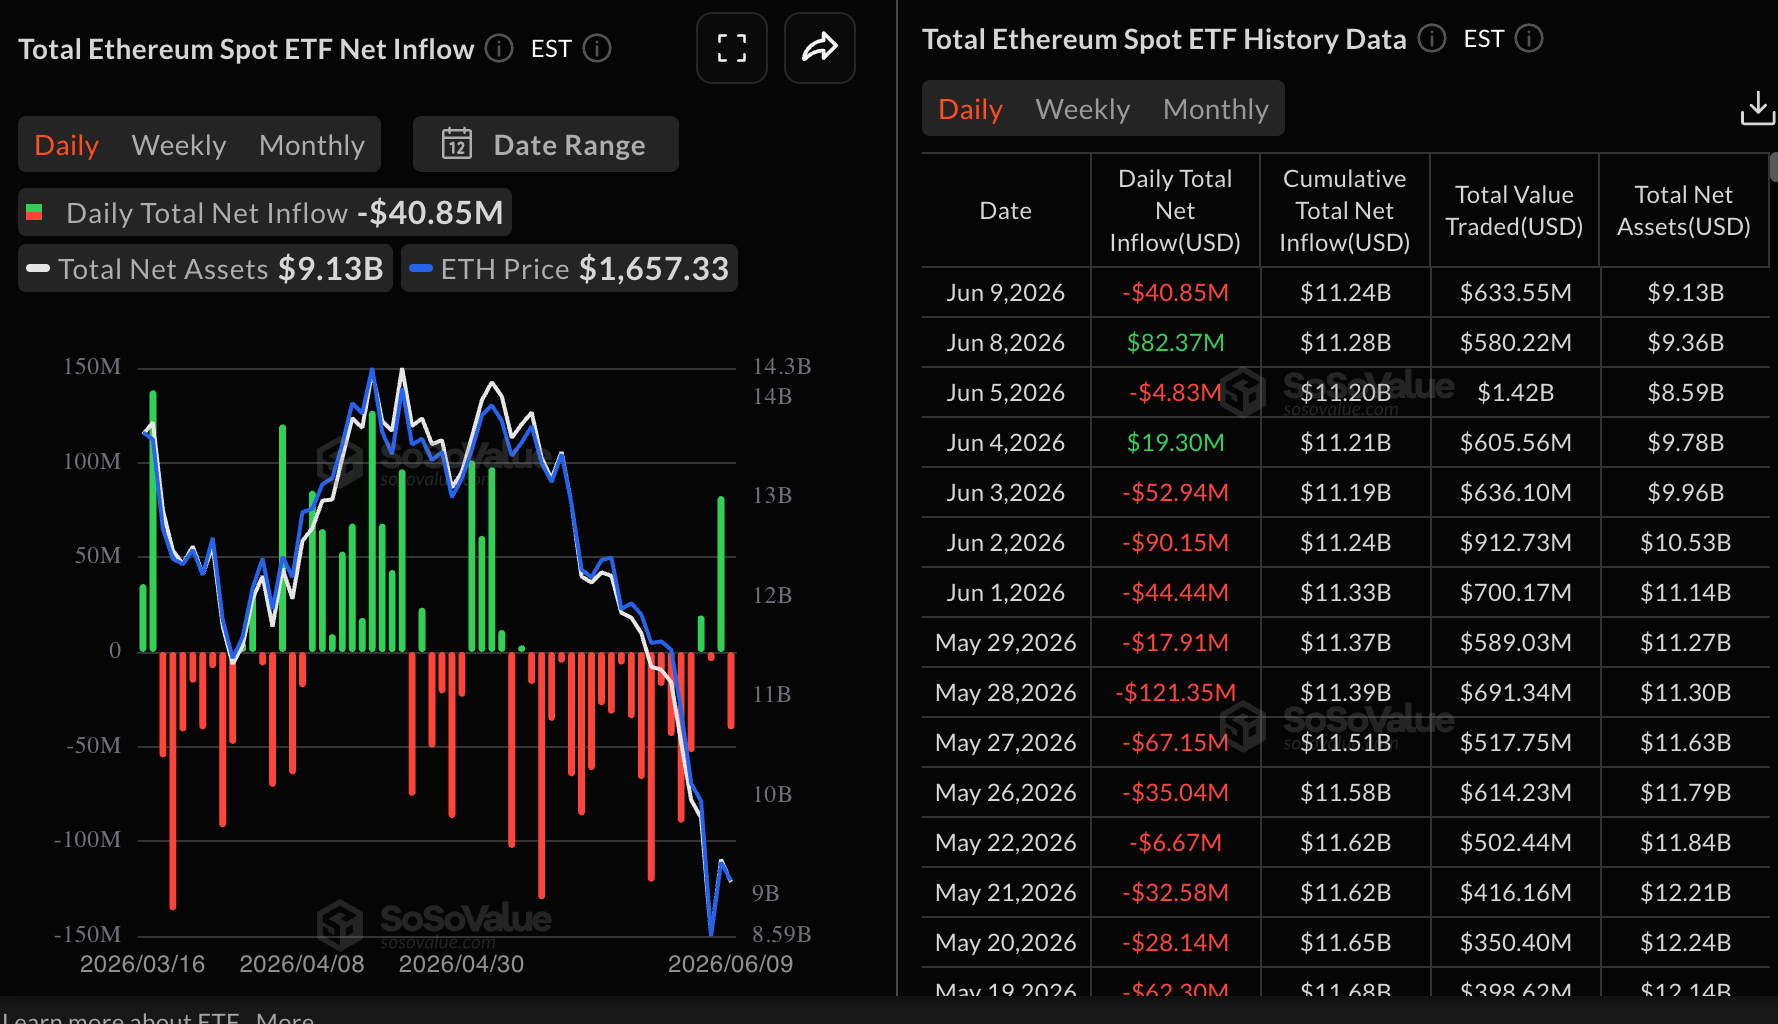
Ethereum spot ETFs turned bearish on Tuesday, with outflows totaling $41 million despite recording $82 million in inflows on the previous day. Overall, SoSoValue data shows a persistent downtrend since early May, implying that risk-off sentiment is dominant.
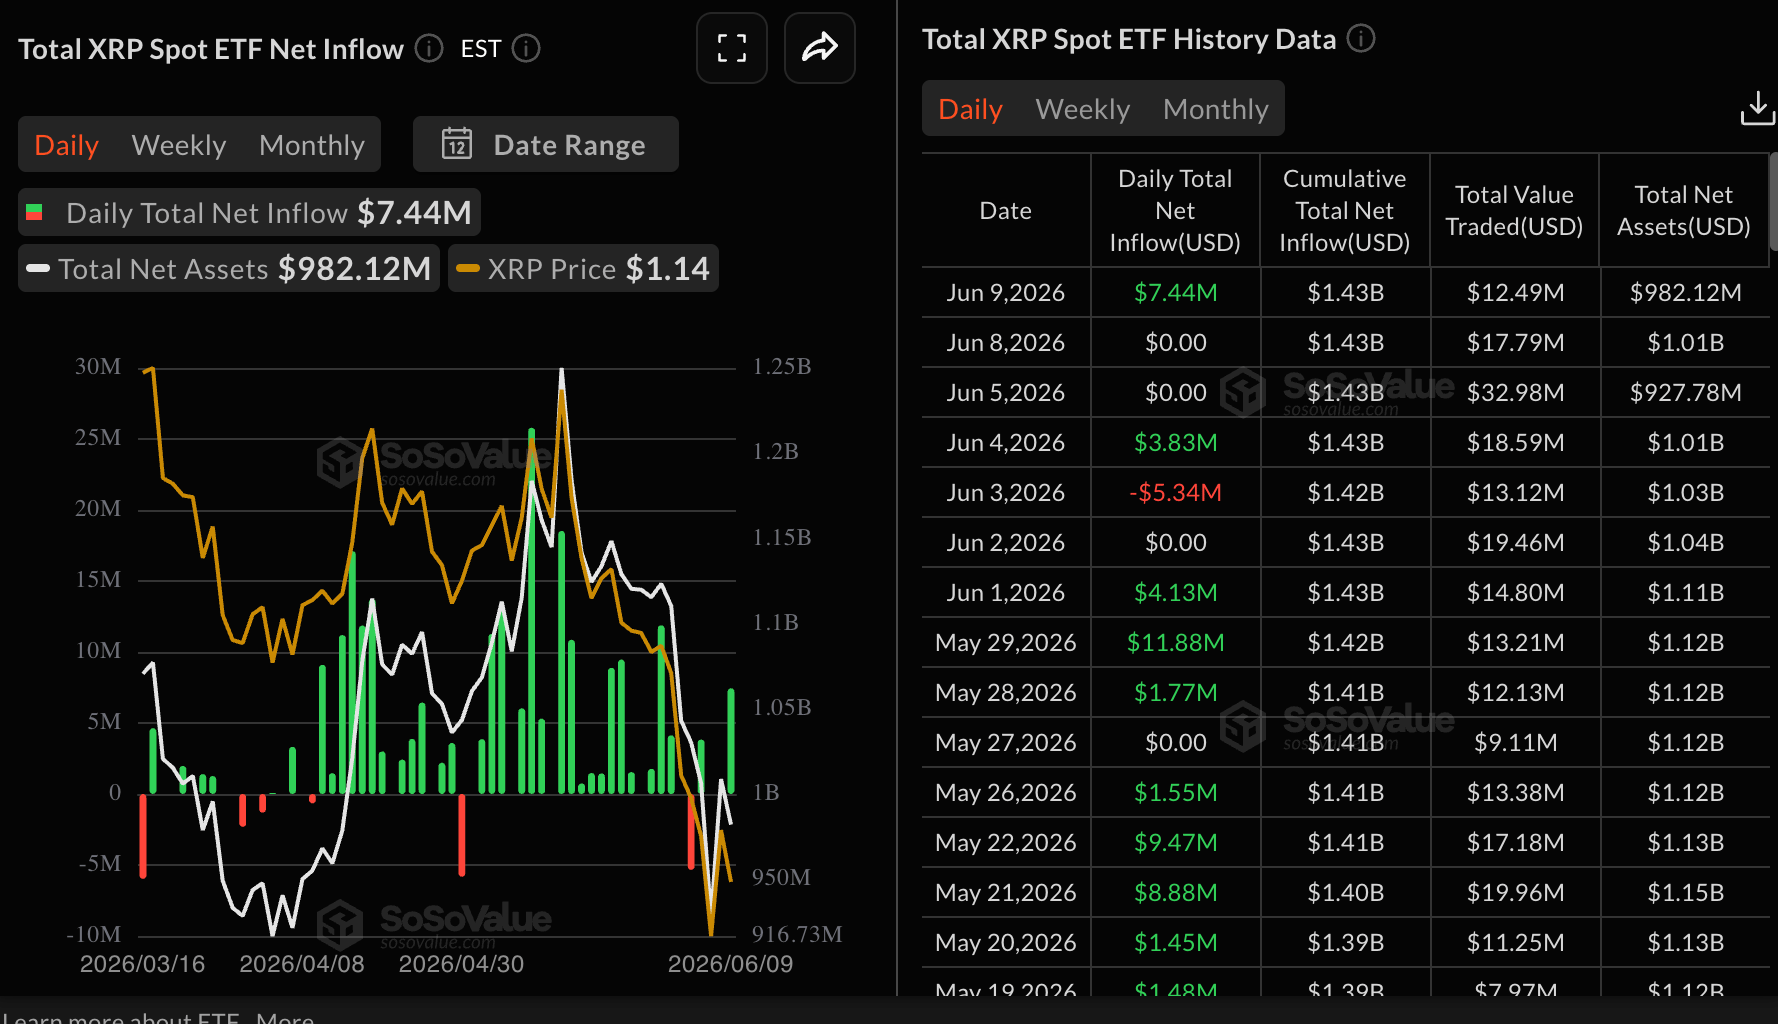
Meanwhile, XRP spot ETFs edged higher on Tuesday, attracting inflows of $7.44 million following muted activity on Friday and Monday. Cumulative inflows are steady at $1.43 billion, while net assets average $982 million.
Price analysis: Bitcoin maintains a bearish outlook
Bitcoin trades at slightly above $63,000, keeping a clear bearish near‑term bias as spot holds well beneath the SuperTrend line at $68,416 and a stacked set of Exponential Moving Averages (EMAs). The 50-day EMA at $72,028, the 100-day EMA at 7$4,224 and the 200-day EMA near $79,497 all sit overhead, suggesting rallies are likely to encounter supply before any sustained recovery can take hold.
Momentum conditions reinforce the downside tone, with the Relative Strength Index (RSI) deeply oversold around 24 on the daily chart and the Moving Average Convergence Divergence (MACD) histogram firmly negative, hinting that while a corrective bounce is possible, the broader structure remains pressured.
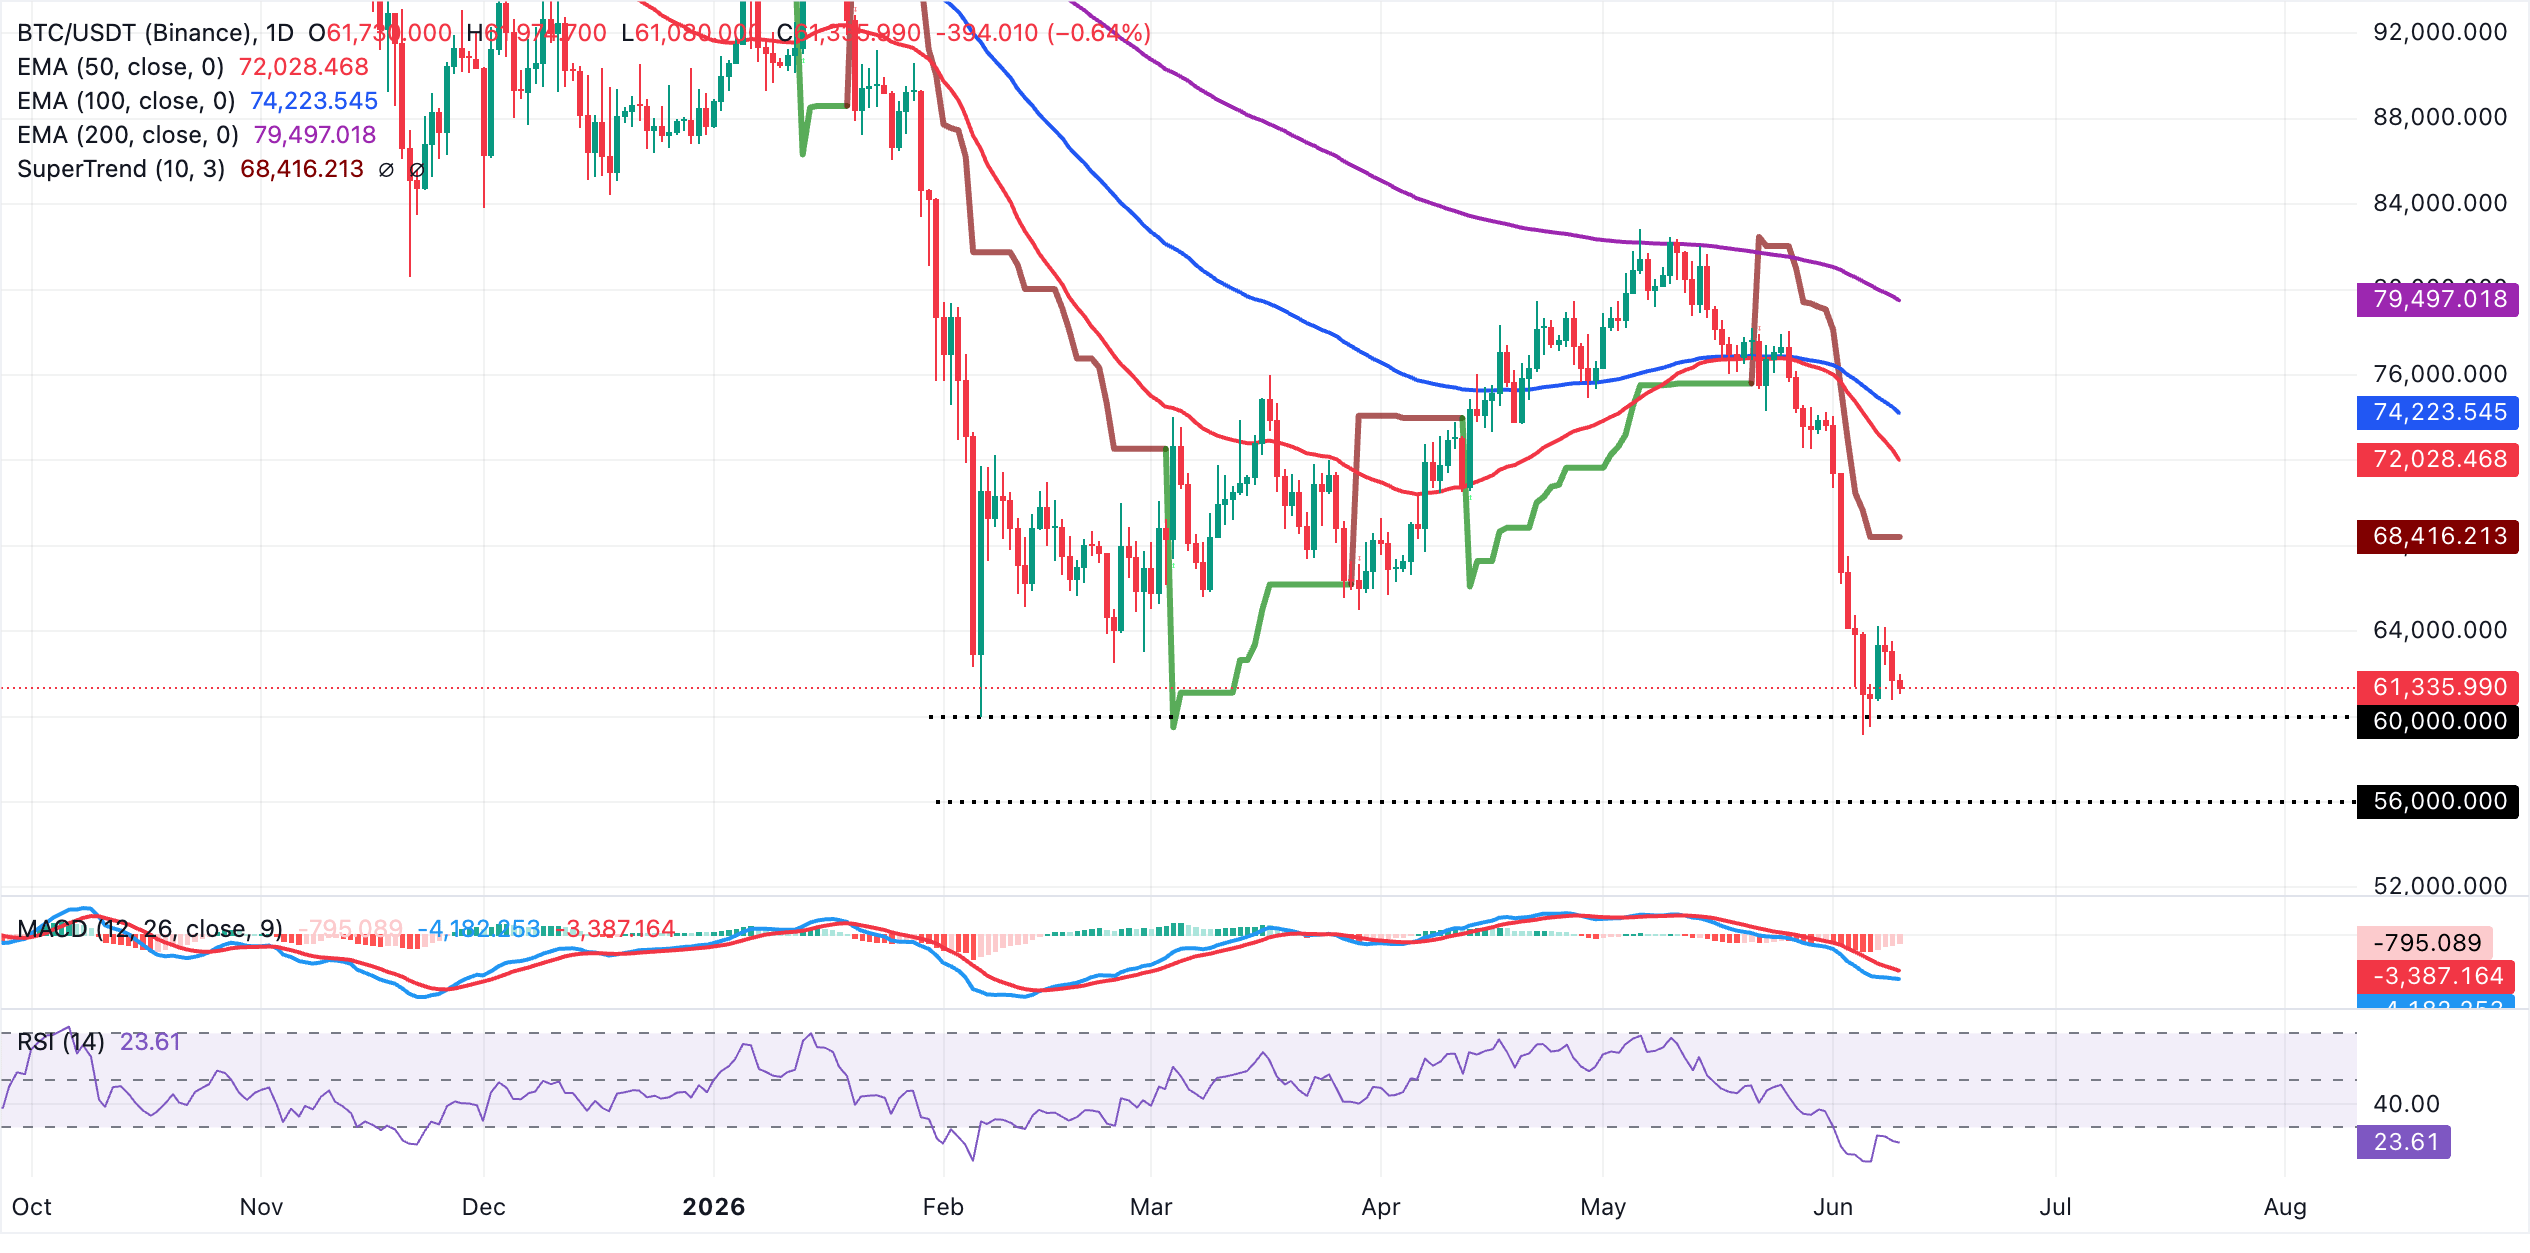
On the topside, initial resistance is defined by the SuperTrend barrier at $68,416, which is the first level bulls would need to reclaim to alleviate immediate selling pressure. Above that, the 50-day EMA at $72,028, followed by the 100-day EMA at $74,224, build a dense resistance zone ahead of the more prominent 200-day EMA near $79,497. If the sell-off persists, psychological levels of interest for buyers lie at $60,000 and $56,000.
Altcoin technical outlook: Ethereum and XRP entrenched in bearish outlook
Ethereum trades above $1,600 support but remains entrenched in a bearish near-term bias, with price holding well below the 50-day, 100-day and 200-day EMAs. The latest SuperTrend line around $1,850 also sits overhead, reinforcing a downside-controlled setup despite the RSI slipping into oversold territory near 25 on the daily chart, which hints at stretched conditions but not yet a reversal.
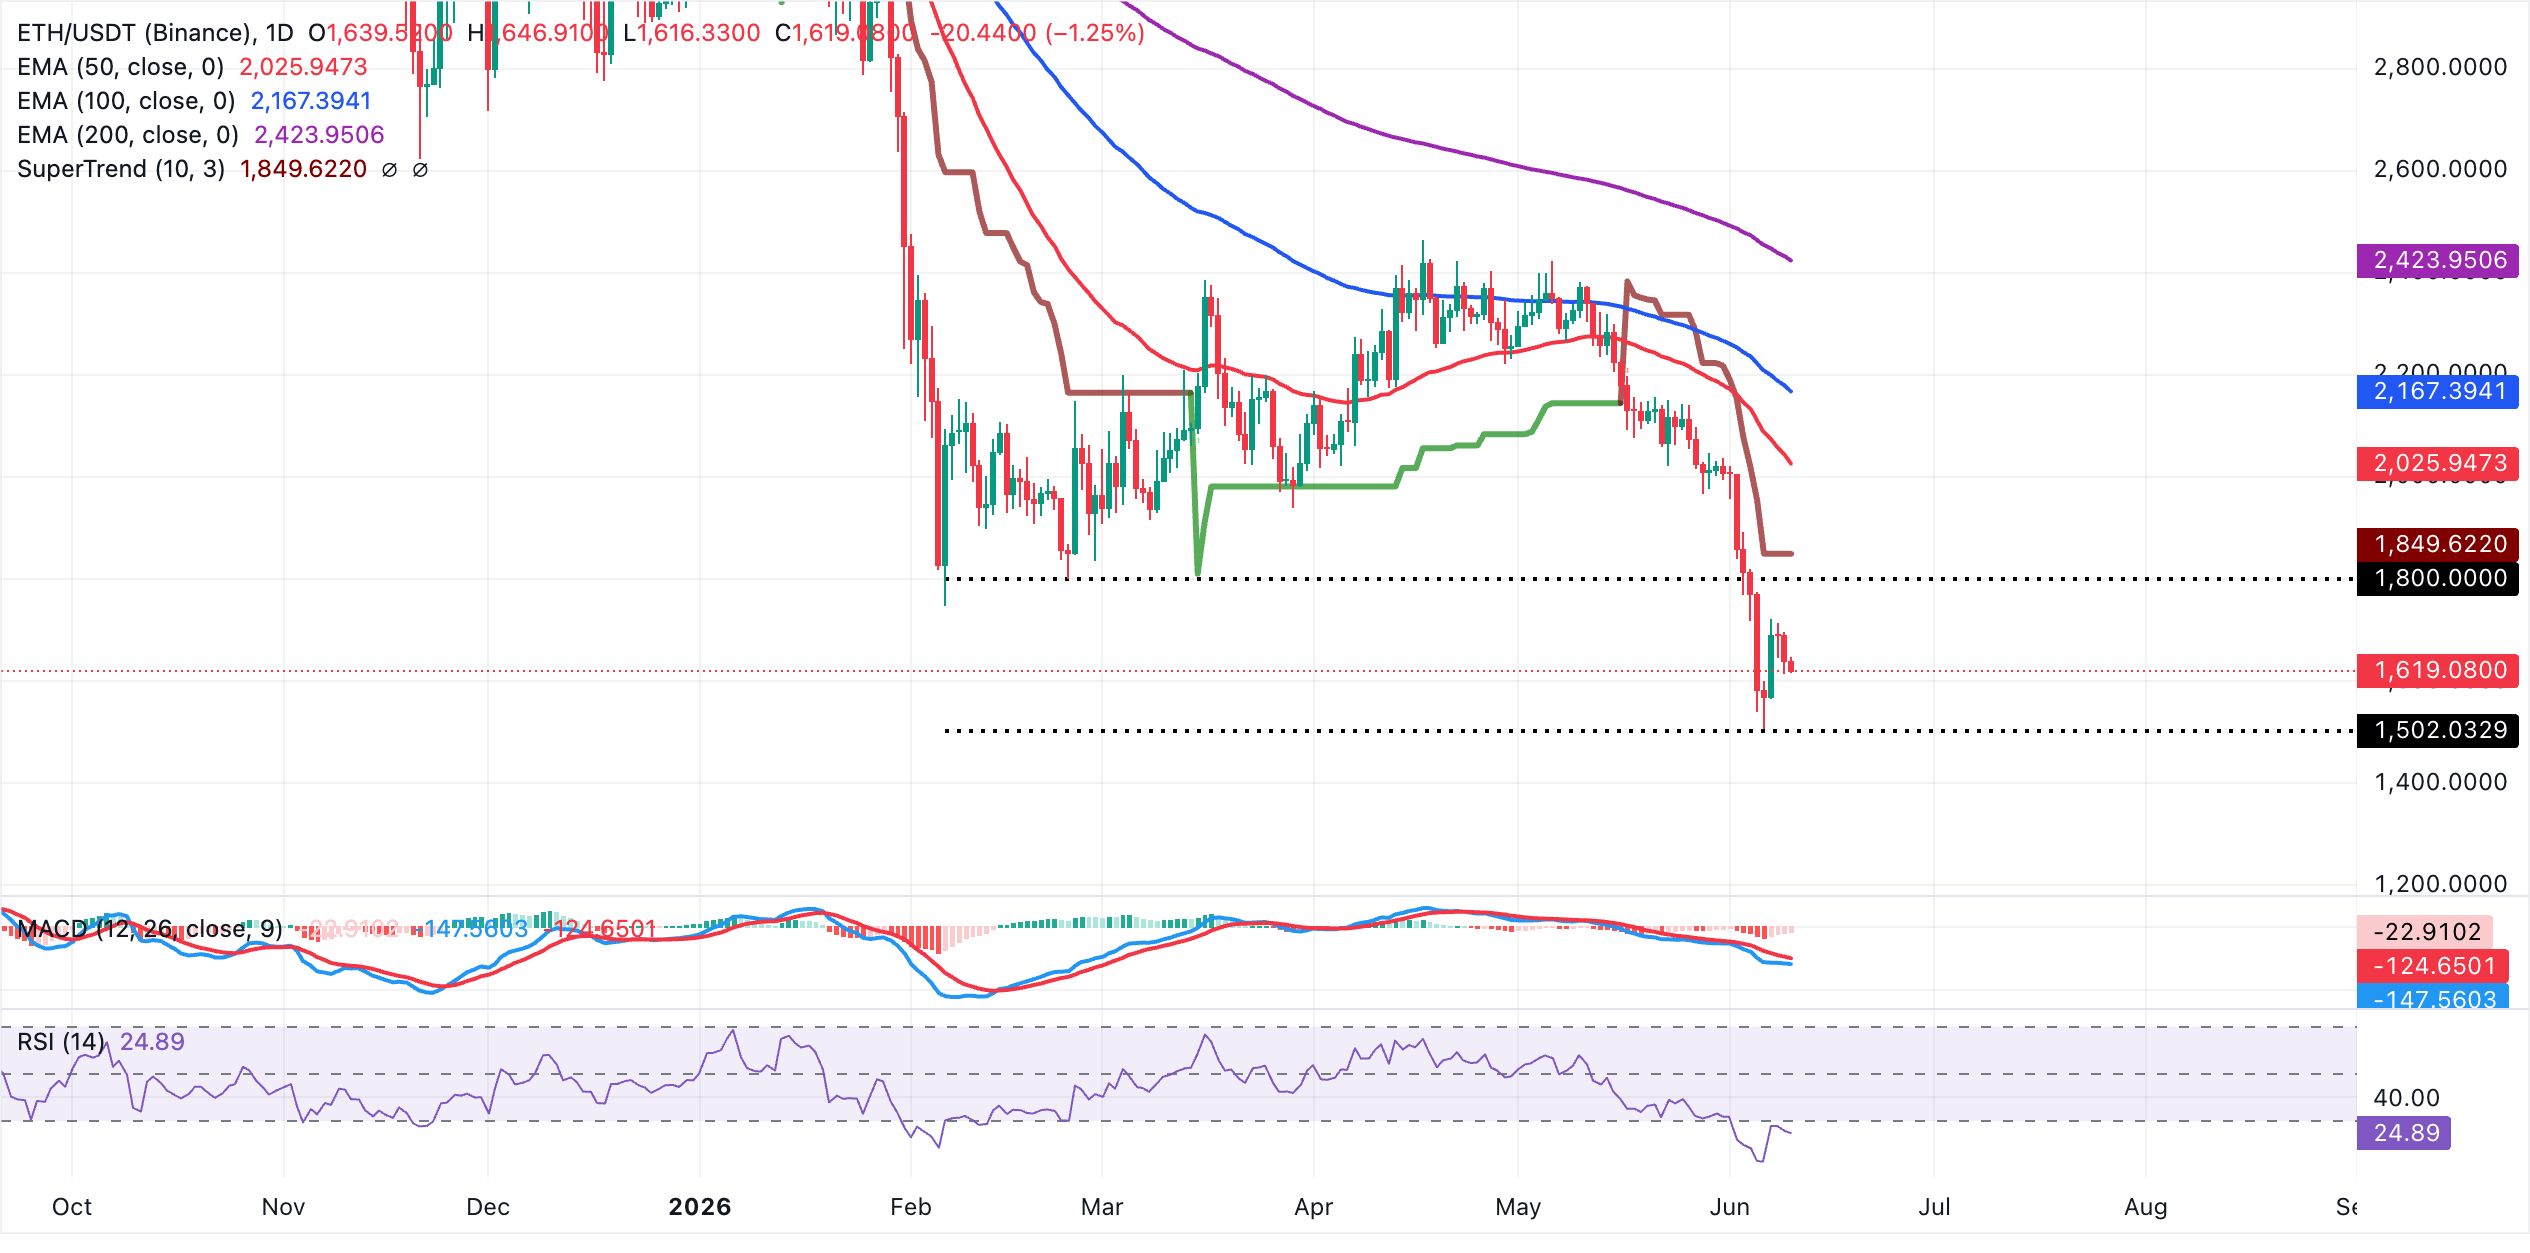
On the topside, initial resistance lies at the SuperTrend barrier near $1,850, ahead of the 50-day EMA around $2,026. A daily close above these hurdles would be needed to ease immediate selling pressure. Further up, the 100-day EMA at roughly $2,167 and the 200-day EMA near $2,424 form a broader resistance band that caps any deeper recovery attempts, while on the downside traders will look to recent cycle lows and round numbers for potential interim support. For instance, $1,600 and $1,500, respectively.
XRP, on the other hand, trades at $1.11, while remaining under robust bearish pressure, The spot price holds below the SuperTrend line at $1.26 and well beneath the 50-day, 100-day and 200-day EMAs at $1.31, $1.40 and $1.62 respectively, suggesting the broader trend stays capped despite a deeply oversold RSI at about 29 on the daily chart.
The MACD histogram sits in negative territory with a negative reading, hinting that bearish momentum persists even as conditions appear stretched.
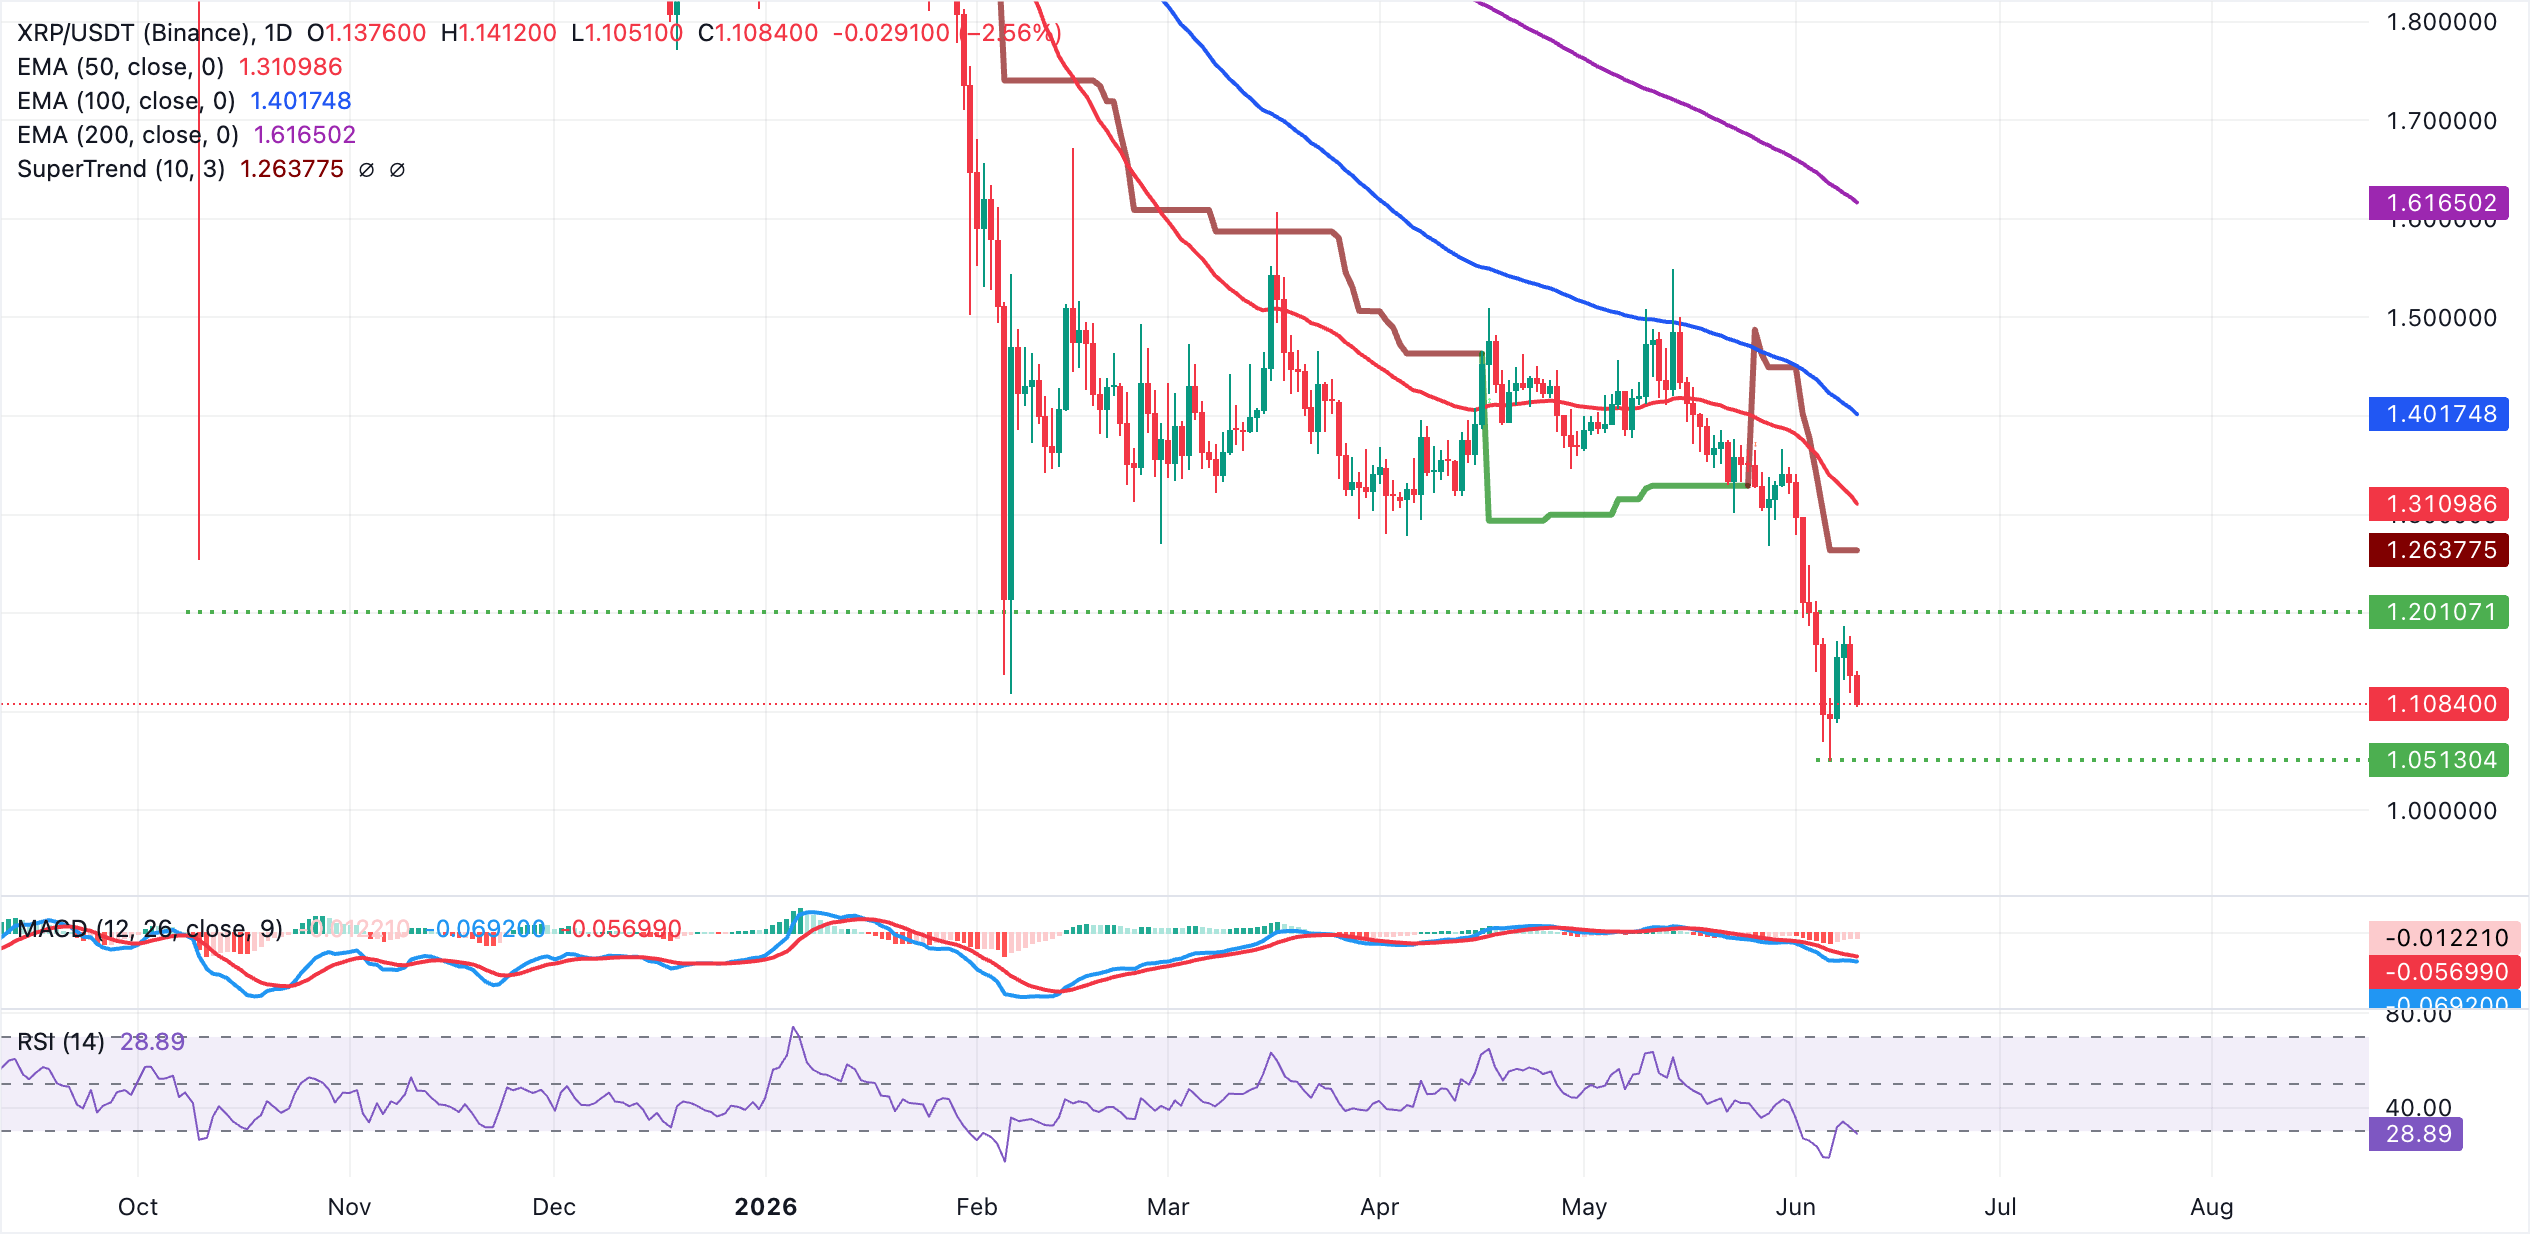
On the topside, initial resistance is seen at the SuperTrend level near $1.26, where a daily close above would be needed to ease immediate selling pressure. Further up, the 50-day EMA at $1.31 is followed by the 100-day EMA at $1.40, while the 200-day EMA near $1.62 defines the upper boundary of the broader bearish structure. As long as XRP trades below this cluster of moving averages, rallies are likely to be viewed as corrective.
(The technical analysis of this story was written with the help of an AI tool.)
Crypto ETF FAQs
An Exchange-Traded Fund (ETF) is an investment vehicle or an index that tracks the price of an underlying asset. ETFs can not only track a single asset, but a group of assets and sectors. For example, a Bitcoin ETF tracks Bitcoin’s price. ETF is a tool used by investors to gain exposure to a certain asset.
Yes. The first Bitcoin futures ETF in the US was approved by the US Securities & Exchange Commission in October 2021. A total of seven Bitcoin futures ETFs have been approved, with more than 20 still waiting for the regulator’s permission. The SEC says that the cryptocurrency industry is new and subject to manipulation, which is why it has been delaying crypto-related futures ETFs for the last few years.
Yes. The SEC approved in January 2024 the listing and trading of several Bitcoin spot Exchange-Traded Funds, opening the door to institutional capital and mainstream investors to trade the main crypto currency. The decision was hailed by the industry as a game changer.
The main advantage of crypto ETFs is the possibility of gaining exposure to a cryptocurrency without ownership, reducing the risk and cost of holding the asset. Other pros are a lower learning curve and higher security for investors since ETFs take charge of securing the underlying asset holdings. As for the main drawbacks, the main one is that as an investor you can’t have direct ownership of the asset, or, as they say in crypto, “not your keys, not your coins.” Other disadvantages are higher costs associated with holding crypto since ETFs charge fees for active management. Finally, even though investing in ETFs reduces the risk of holding an asset, price swings in the underlying cryptocurrency are likely to be reflected in the investment vehicle too.

ผู้ใช้กว่าหนึ่งล้านคนพึ่งพา FXStreet สำหรับข้อมูลตลาดเรียลไทม์ เครื่องมือกราฟ การวิเคราะห์จากผู้เชี่ยวชาญ และข่าวฟอเร็กซ์ ปฏิทินเศรษฐกิจที่ครอบคลุมและเว็บบินาร์การศึกษาช่วยให้เทรดเดอร์ทันเหตุการณ์และตัดสินใจอย่างรอบคอบ FXStreet มีทีมงานประมาณ 60 คน แบ่งระหว่างสำนักงานใหญ่บาร์เซโลนาและภูมิภาคต่าง ๆ ทั่วโลก
อ่านเพิ่มเติม


