
EUR/JPY Price Forecast: Holds gains near 185.50 as bullish bias prevails
โดย Akhtar Faruqui
อัปเดตแล้ว: 12 Jun 2026


บทความยอดนิยม

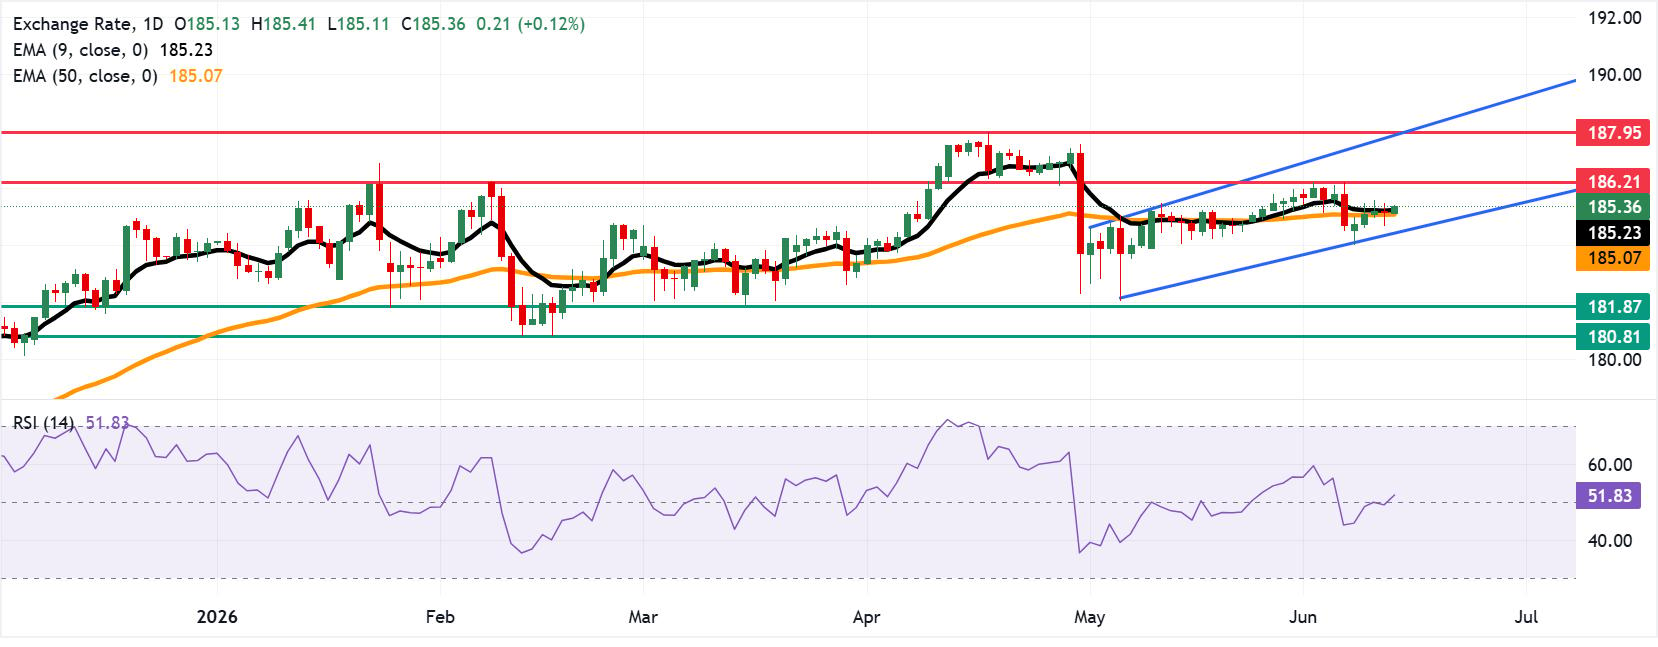
EUR/JPY appreciates after registering minor losses in the previous day, trading around 185.40 during the Asian hours on Friday. The currency cross is holding a constructive bullish bias as spot remains above both the nine-day and 50-day Exponential Moving Averages (EMAs).
- EUR/JPY could target the primary barrier at the six-week high of 186.21.
- The 14-day Relative Strength Index near 52 indicates neutral-to-positive momentum.
- The primary support appears at the nine-day EMA of 185.23.
EUR/JPY appreciates after registering minor losses in the previous day, trading around 185.40 during the Asian hours on Friday. The currency cross is holding a constructive bullish bias as spot remains above both the nine-day and 50-day Exponential Moving Averages (EMAs). The alignment of shorter- and medium-term EMAs below price hints at underlying demand.
Meanwhile, the 14-day Relative Strength Index (RSI) near 52 suggests moderate positive momentum without overbought conditions, allowing room for further upside if buyers retain control. Additionally, the technical analysis of the daily chart suggests the EUR/JPY cross is moving within the ascending channel pattern, suggesting an ongoing bullish bias.
The EUR/JPY cross may find the primary resistance at the six-week high of 186.21, reached on June 5. Further advances would lead the currency cross to approach the upper boundary of the ascending channel around 187.80, followed by the all-time high of 187.95, recorded on April 17.
On the downside, the EUR/JPY cross faces immediate support at its nine-day EMA of 185.23, closely followed by the 50-day EMA at 185.07. A decisive break below these moving averages would trigger a bearish shift, exposing the lower boundary of the ascending channel near 184.50. Extended downward momentum could push the pair to test its nearly four-month low of 181.87, recorded on March 16, with further declines targeting the six-month low of 180.81, reached on February 12.
(The technical analysis of this story was written with the help of an AI tool.)
Euro Price Today
The table below shows the percentage change of Euro (EUR) against listed major currencies today. Euro was the strongest against the New Zealand Dollar.
| USD | EUR | GBP | JPY | CAD | AUD | NZD | CHF | |
|---|---|---|---|---|---|---|---|---|
| USD | 0.12% | 0.10% | 0.19% | 0.08% | 0.26% | 0.38% | 0.15% | |
| EUR | -0.12% | -0.03% | 0.09% | -0.03% | 0.14% | 0.25% | 0.03% | |
| GBP | -0.10% | 0.03% | 0.11% | -0.01% | 0.14% | 0.28% | 0.06% | |
| JPY | -0.19% | -0.09% | -0.11% | -0.14% | 0.03% | 0.16% | -0.07% | |
| CAD | -0.08% | 0.03% | 0.00% | 0.14% | 0.17% | 0.29% | 0.07% | |
| AUD | -0.26% | -0.14% | -0.14% | -0.03% | -0.17% | 0.11% | -0.12% | |
| NZD | -0.38% | -0.25% | -0.28% | -0.16% | -0.29% | -0.11% | -0.22% | |
| CHF | -0.15% | -0.03% | -0.06% | 0.07% | -0.07% | 0.12% | 0.22% |
The heat map shows percentage changes of major currencies against each other. The base currency is picked from the left column, while the quote currency is picked from the top row. For example, if you pick the Euro from the left column and move along the horizontal line to the US Dollar, the percentage change displayed in the box will represent EUR (base)/USD (quote).

ผู้ใช้กว่าหนึ่งล้านคนพึ่งพา FXStreet สำหรับข้อมูลตลาดเรียลไทม์ เครื่องมือกราฟ การวิเคราะห์จากผู้เชี่ยวชาญ และข่าวฟอเร็กซ์ ปฏิทินเศรษฐกิจที่ครอบคลุมและเว็บบินาร์การศึกษาช่วยให้เทรดเดอร์ทันเหตุการณ์และตัดสินใจอย่างรอบคอบ FXStreet มีทีมงานประมาณ 60 คน แบ่งระหว่างสำนักงานใหญ่บาร์เซโลนาและภูมิภาคต่าง ๆ ทั่วโลก
อ่านเพิ่มเติม


