
EUR/JPY Price Forecast: Remains below nine-day confluence near 187.00
โดย Akhtar Faruqui
อัปเดตแล้ว: 29 Apr 2026


บทความยอดนิยม

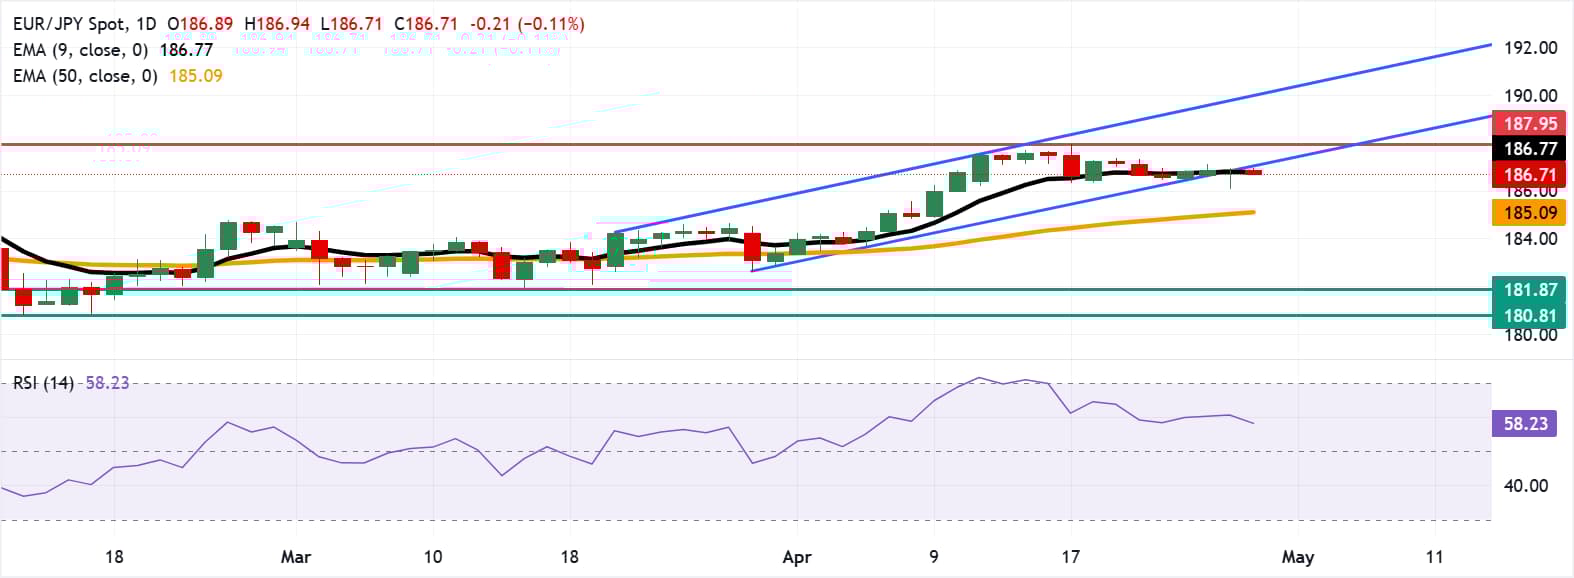
EUR/JPY depreciates after three days of gains, trading around 186.70 during European hours on Wednesday. The technical analysis of the daily chart indicates the currency cross is positioned slightly below the ascending channel, signaling a possible bearish reversal.
- EUR/JPY is positioned slightly below the nine-day EMA at 186.77, aligned with the lower ascending channel boundary.
- The 14-day Relative Strength Index near 59 signals solid upside momentum without indicating overbought conditions.
- The currency cross may fall toward the 50-day EMA at 185.09.
EUR/JPY depreciates after three days of gains, trading around 186.70 during European hours on Wednesday. The technical analysis of the daily chart indicates the currency cross is positioned slightly below the ascending channel, signaling a possible bearish reversal.
However, the EUR/JPY cross maintains a constructive bullish bias as it holds above the 50-period Exponential Moving Average (EMA), while oscillating just under the nine-period EMA, which acts as immediate resistance.
The 14-day Relative Strength Index is around 59 points to firm but not overextended upside momentum, suggesting dips may continue to attract buyers while the EUR/JPY cross consolidates beneath the recent highs.
The successful rebound above the nine-day EMA at 186.77 and a return within the ascending channel would reinforce the bullish bias and lead the EUR/JPY cross to test the all-time high of 187.95, which was recorded on April 17. A break above this level would lead the currency cross to explore the region around the upper boundary of the channel, around 190.20.
On the downside, the EUR/JPY cross may navigate the region around the initial support, which lies at the 50-day EMA at 185.09.
(The technical analysis of this story was written with the help of an AI tool.)
Euro Price Today
The table below shows the percentage change of Euro (EUR) against listed major currencies today. Euro was the weakest against the Swiss Franc.
| USD | EUR | GBP | JPY | CAD | AUD | NZD | CHF | |
|---|---|---|---|---|---|---|---|---|
| USD | 0.09% | 0.11% | 0.02% | 0.05% | 0.28% | 0.34% | -0.04% | |
| EUR | -0.09% | 0.02% | -0.07% | -0.04% | 0.18% | 0.27% | -0.14% | |
| GBP | -0.11% | -0.02% | -0.09% | -0.06% | 0.15% | 0.24% | -0.16% | |
| JPY | -0.02% | 0.07% | 0.09% | 0.03% | 0.27% | 0.35% | -0.01% | |
| CAD | -0.05% | 0.04% | 0.06% | -0.03% | 0.25% | 0.31% | -0.09% | |
| AUD | -0.28% | -0.18% | -0.15% | -0.27% | -0.25% | 0.07% | -0.35% | |
| NZD | -0.34% | -0.27% | -0.24% | -0.35% | -0.31% | -0.07% | -0.40% | |
| CHF | 0.04% | 0.14% | 0.16% | 0.01% | 0.09% | 0.35% | 0.40% |
The heat map shows percentage changes of major currencies against each other. The base currency is picked from the left column, while the quote currency is picked from the top row. For example, if you pick the Euro from the left column and move along the horizontal line to the US Dollar, the percentage change displayed in the box will represent EUR (base)/USD (quote).

ผู้ใช้กว่าหนึ่งล้านคนพึ่งพา FXStreet สำหรับข้อมูลตลาดเรียลไทม์ เครื่องมือกราฟ การวิเคราะห์จากผู้เชี่ยวชาญ และข่าวฟอเร็กซ์ ปฏิทินเศรษฐกิจที่ครอบคลุมและเว็บบินาร์การศึกษาช่วยให้เทรดเดอร์ทันเหตุการณ์และตัดสินใจอย่างรอบคอบ FXStreet มีทีมงานประมาณ 60 คน แบ่งระหว่างสำนักงานใหญ่บาร์เซโลนาและภูมิภาคต่าง ๆ ทั่วโลก
อ่านเพิ่มเติม


