
Indian Rupee steadies due to risk-on mood
โดย Akhtar Faruqui
อัปเดตแล้ว: 17 Jun 2026


บทความยอดนิยม

The Indian Rupee (INR) holds ground after two days of gains against the US Dollar (USD) on Wednesday. However, the upside potential for the USD/INR pair could be capped in the near term as downward pressure on the Indian Rupee eases, supported by declining global oil prices.
- The Indian Rupee holds ground as oil prices continue to ease.
- Indian shares opened higher but edged lower as caution grew ahead of the US Fed policy decision.
- Traders expect a hawkish tone from Fed Chair Kevin Warsh during his first policy meeting on Wednesday.
The Indian Rupee (INR) holds ground after two days of gains against the US Dollar (USD) on Wednesday. However, the upside potential for the USD/INR pair could be capped in the near term as downward pressure on the Indian Rupee eases, supported by declining global oil prices.
Following recent policy interventions by the Reserve Bank of India (RBI), economists have notably upgraded their forecasts for the nation's balance of payments. Most analysts now anticipate a small surplus, marking a sharp reversal from previous projections of a substantial deficit.
However, the true extent of any Rupee rally will ultimately hinge on the central bank's comfort level. Experts suggest the RBI may strategically leverage the currency's strength to pare down its massive foreign exchange forward book, which saw short-dollar positions balloon to a record $104 billion in March during efforts to defend the INR.
Indian equity indexes edge lower after opening at a bullish gap on Wednesday as caution takes hold ahead of the US Federal Reserve's (Fed) upcoming policy decision. The US central bank is widely expected to maintain its cautious "wait-and-see" stance, keeping benchmark interest rates steady within the 3.50% to 3.75% range.
Nevertheless, market participants remain highly attentive, as traders expect Fed Chair Kevin Warsh to adopt a more hawkish tone during his first policy meeting later in the day. This cautious domestic sentiment follows a mixed session on Tuesday, where institutional data from the NSE revealed that foreign institutional investors sold shares worth INR 749.18 crore, while domestic institutional investors made modest purchases worth INR 6 lakhs.
Broader market sentiment also faces headwinds from lingering global uncertainties and geopolitical frictions. Industry experts express widespread skepticism regarding a swift economic rebound, warning that shipping and energy exports could take several weeks to fully recover from recent disruptions. Complicating the global outlook further, the Iran-backed group Hezbollah stated in Lebanon that Iran would likely refuse a final nuclear agreement unless Israel withdraws from Lebanese territory, adding a layer of geopolitical risk that continues to keep investors on edge.
West Texas Intermediate (WTI) oil price extends losses for the fifth successive day, trading around $75.20 per barrel at the time of writing. Crude oil prices decline as anticipation grew over a looming United States (US)-Iran peace deal that could significantly boost global supply.
The US and Iran are scheduled to sign an interim agreement in Switzerland this Friday, which would grant Tehran broad economic incentives and allow the immediate resumption of Iranian oil exports. Furthermore, international tankers are expected to resume safe transit through the strategic Strait of Hormuz once the pact officially takes effect.
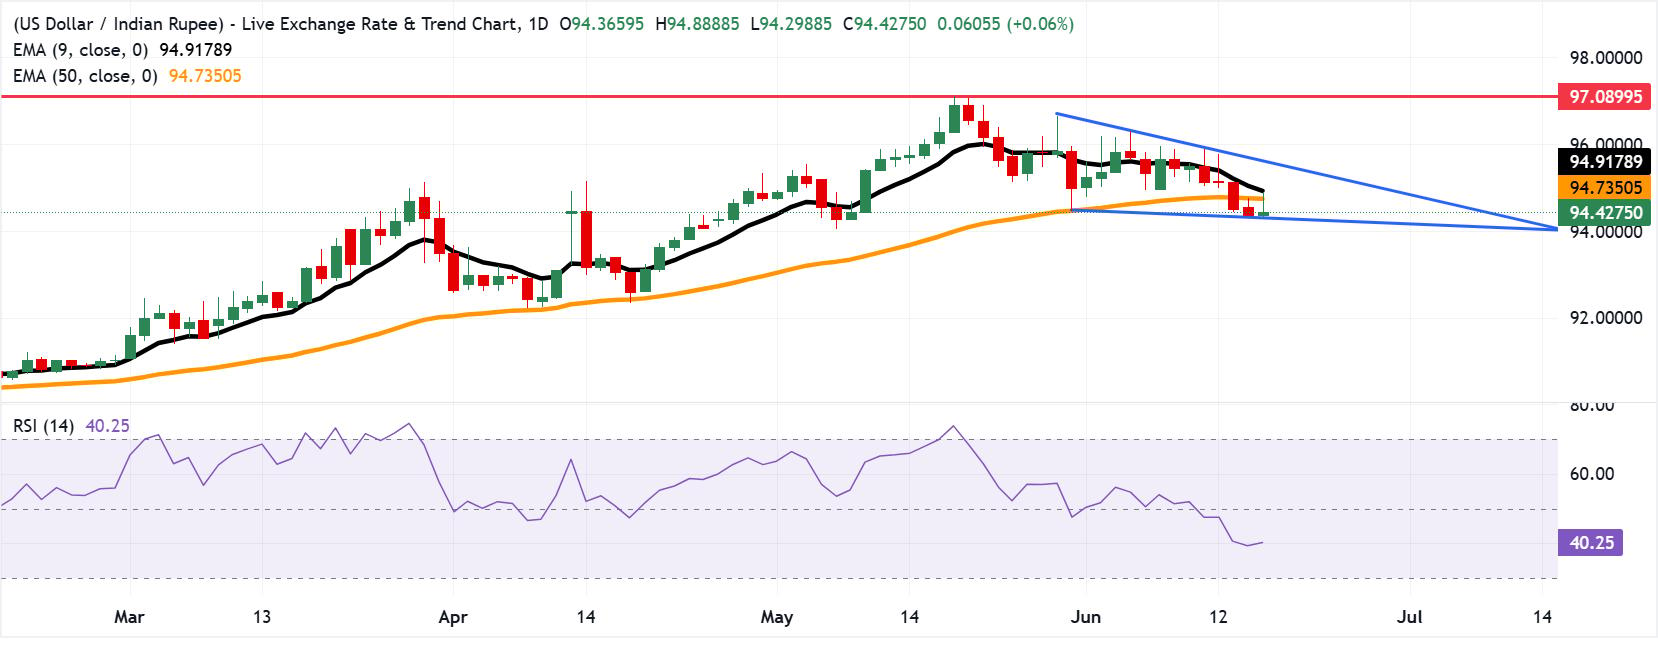
Technical Analysis: USD/INR trades near 94.50 above descending triangle bottom
USD/INR flattens after two days of losses, trading around 94.40 at the time of writing. The technical analysis of the daily chart suggests that spot price sits just slightly above the lower boundary of the descending triangle, indicating the "drumroll" moment of the pattern.
The flat lower boundary represents a major demand zone where buyers have historically stepped in to stop the bleeding. When the spot price hovers just above it, the market is testing whether those buyers still have the cash and the will to defend that floor.
The USD/INR pair maintains a bearish near-term tone as it holds below both the nine-day and 50-day Exponential moving averages (EMAs). The clustering of these EMAs above the spot hints at a capped market, while the 14-day Relative Strength Index (RSI) around 40 suggests weak momentum, reinforcing the risk of further downside as long as price remains suppressed beneath these moving averages.
The immediate support lies at the lower boundary of the descending triangle around 94.30, while the initial resistance lies at the 50-day EMA of 94.73, followed by the nine-day EMA at 94.91.
US Dollar Price Today
The table below shows the percentage change of US Dollar (USD) against listed major currencies today. US Dollar was the strongest against the New Zealand Dollar.
| USD | EUR | GBP | JPY | CAD | AUD | NZD | INR | |
|---|---|---|---|---|---|---|---|---|
| USD | -0.03% | -0.02% | -0.11% | 0.03% | 0.07% | 0.07% | -0.05% | |
| EUR | 0.03% | 0.00% | -0.06% | 0.04% | 0.08% | 0.12% | -0.23% | |
| GBP | 0.02% | -0.01% | -0.06% | 0.05% | 0.09% | 0.12% | -0.01% | |
| JPY | 0.11% | 0.06% | 0.06% | 0.12% | 0.16% | 0.13% | -0.16% | |
| CAD | -0.03% | -0.04% | -0.05% | -0.12% | 0.04% | 0.05% | -0.28% | |
| AUD | -0.07% | -0.08% | -0.09% | -0.16% | -0.04% | 0.03% | -0.33% | |
| NZD | -0.07% | -0.12% | -0.12% | -0.13% | -0.05% | -0.03% | -0.21% | |
| INR | 0.05% | 0.23% | 0.01% | 0.16% | 0.28% | 0.33% | 0.21% |
The heat map shows percentage changes of major currencies against each other. The base currency is picked from the left column, while the quote currency is picked from the top row. For example, if you pick the US Dollar from the left column and move along the horizontal line to the Japanese Yen, the percentage change displayed in the box will represent USD (base)/JPY (quote).
Indian Rupee FAQs
The Indian Rupee (INR) is one of the most sensitive currencies to external factors. The price of Crude Oil (the country is highly dependent on imported Oil), the value of the US Dollar – most trade is conducted in USD – and the level of foreign investment, are all influential. Direct intervention by the Reserve Bank of India (RBI) in FX markets to keep the exchange rate stable, as well as the level of interest rates set by the RBI, are further major influencing factors on the Rupee.
The Reserve Bank of India (RBI) actively intervenes in forex markets to maintain a stable exchange rate, to help facilitate trade. In addition, the RBI tries to maintain the inflation rate at its 4% target by adjusting interest rates. Higher interest rates usually strengthen the Rupee. This is due to the role of the ‘carry trade’ in which investors borrow in countries with lower interest rates so as to place their money in countries’ offering relatively higher interest rates and profit from the difference.
Macroeconomic factors that influence the value of the Rupee include inflation, interest rates, the economic growth rate (GDP), the balance of trade, and inflows from foreign investment. A higher growth rate can lead to more overseas investment, pushing up demand for the Rupee. A less negative balance of trade will eventually lead to a stronger Rupee. Higher interest rates, especially real rates (interest rates less inflation) are also positive for the Rupee. A risk-on environment can lead to greater inflows of Foreign Direct and Indirect Investment (FDI and FII), which also benefit the Rupee.
Higher inflation, particularly, if it is comparatively higher than India’s peers, is generally negative for the currency as it reflects devaluation through oversupply. Inflation also increases the cost of exports, leading to more Rupees being sold to purchase foreign imports, which is Rupee-negative. At the same time, higher inflation usually leads to the Reserve Bank of India (RBI) raising interest rates and this can be positive for the Rupee, due to increased demand from international investors. The opposite effect is true of lower inflation.

ผู้ใช้กว่าหนึ่งล้านคนพึ่งพา FXStreet สำหรับข้อมูลตลาดเรียลไทม์ เครื่องมือกราฟ การวิเคราะห์จากผู้เชี่ยวชาญ และข่าวฟอเร็กซ์ ปฏิทินเศรษฐกิจที่ครอบคลุมและเว็บบินาร์การศึกษาช่วยให้เทรดเดอร์ทันเหตุการณ์และตัดสินใจอย่างรอบคอบ FXStreet มีทีมงานประมาณ 60 คน แบ่งระหว่างสำนักงานใหญ่บาร์เซโลนาและภูมิภาคต่าง ๆ ทั่วโลก
อ่านเพิ่มเติม


