

Ripple Price Forecast: XRP extends gains as cooling signs in US inflation mount
- XRP rises above $1.10 short-term support, reflecting an improvement in risk-on sentiment following weaker-than-expected US inflation data.
- Binance’s XRP reserves have stabilized around $2.9 billion in July, hinting at reduced selling pressure.
- XRP’s upside remains capped by downtrending moving averages and a broader bearish outlook in the crypto market.
Ripple (XRP) holds above support reclaimed at $1.10 at the time of writing on Wednesday, extending its rally after the US Producer Price Index (PPI) data for June showed that price pressures in the world’s largest economy are cooling. The report reinforced the trend seen in Tuesday’s Consumer Price Index (CPI) figures, fueling optimism across crypto markets.

Softer US PPI, CPI boost short-term outlook
The Bureau of Labor Statistics (BLS) CPI reported that inflation fell by 0.4% in June on a seasonally-adjusted basis, marking the sharpest monthly decrease since April 2020.
This pullback brought the annual headline inflation rate down to 3.5% from 4.2% in May. Core inflation, which excludes the more volatile food and energy prices, remained flat MoM, while the annual rate fell to 2.6% from 2.9% in May.
On Wednesday, additional US data showed that the Producer Price Index (PPI), a key gauge of future inflation pressures, rose at a lower pace than expected, easing market concerns over a persistent inflation wave and supporting risk assets.
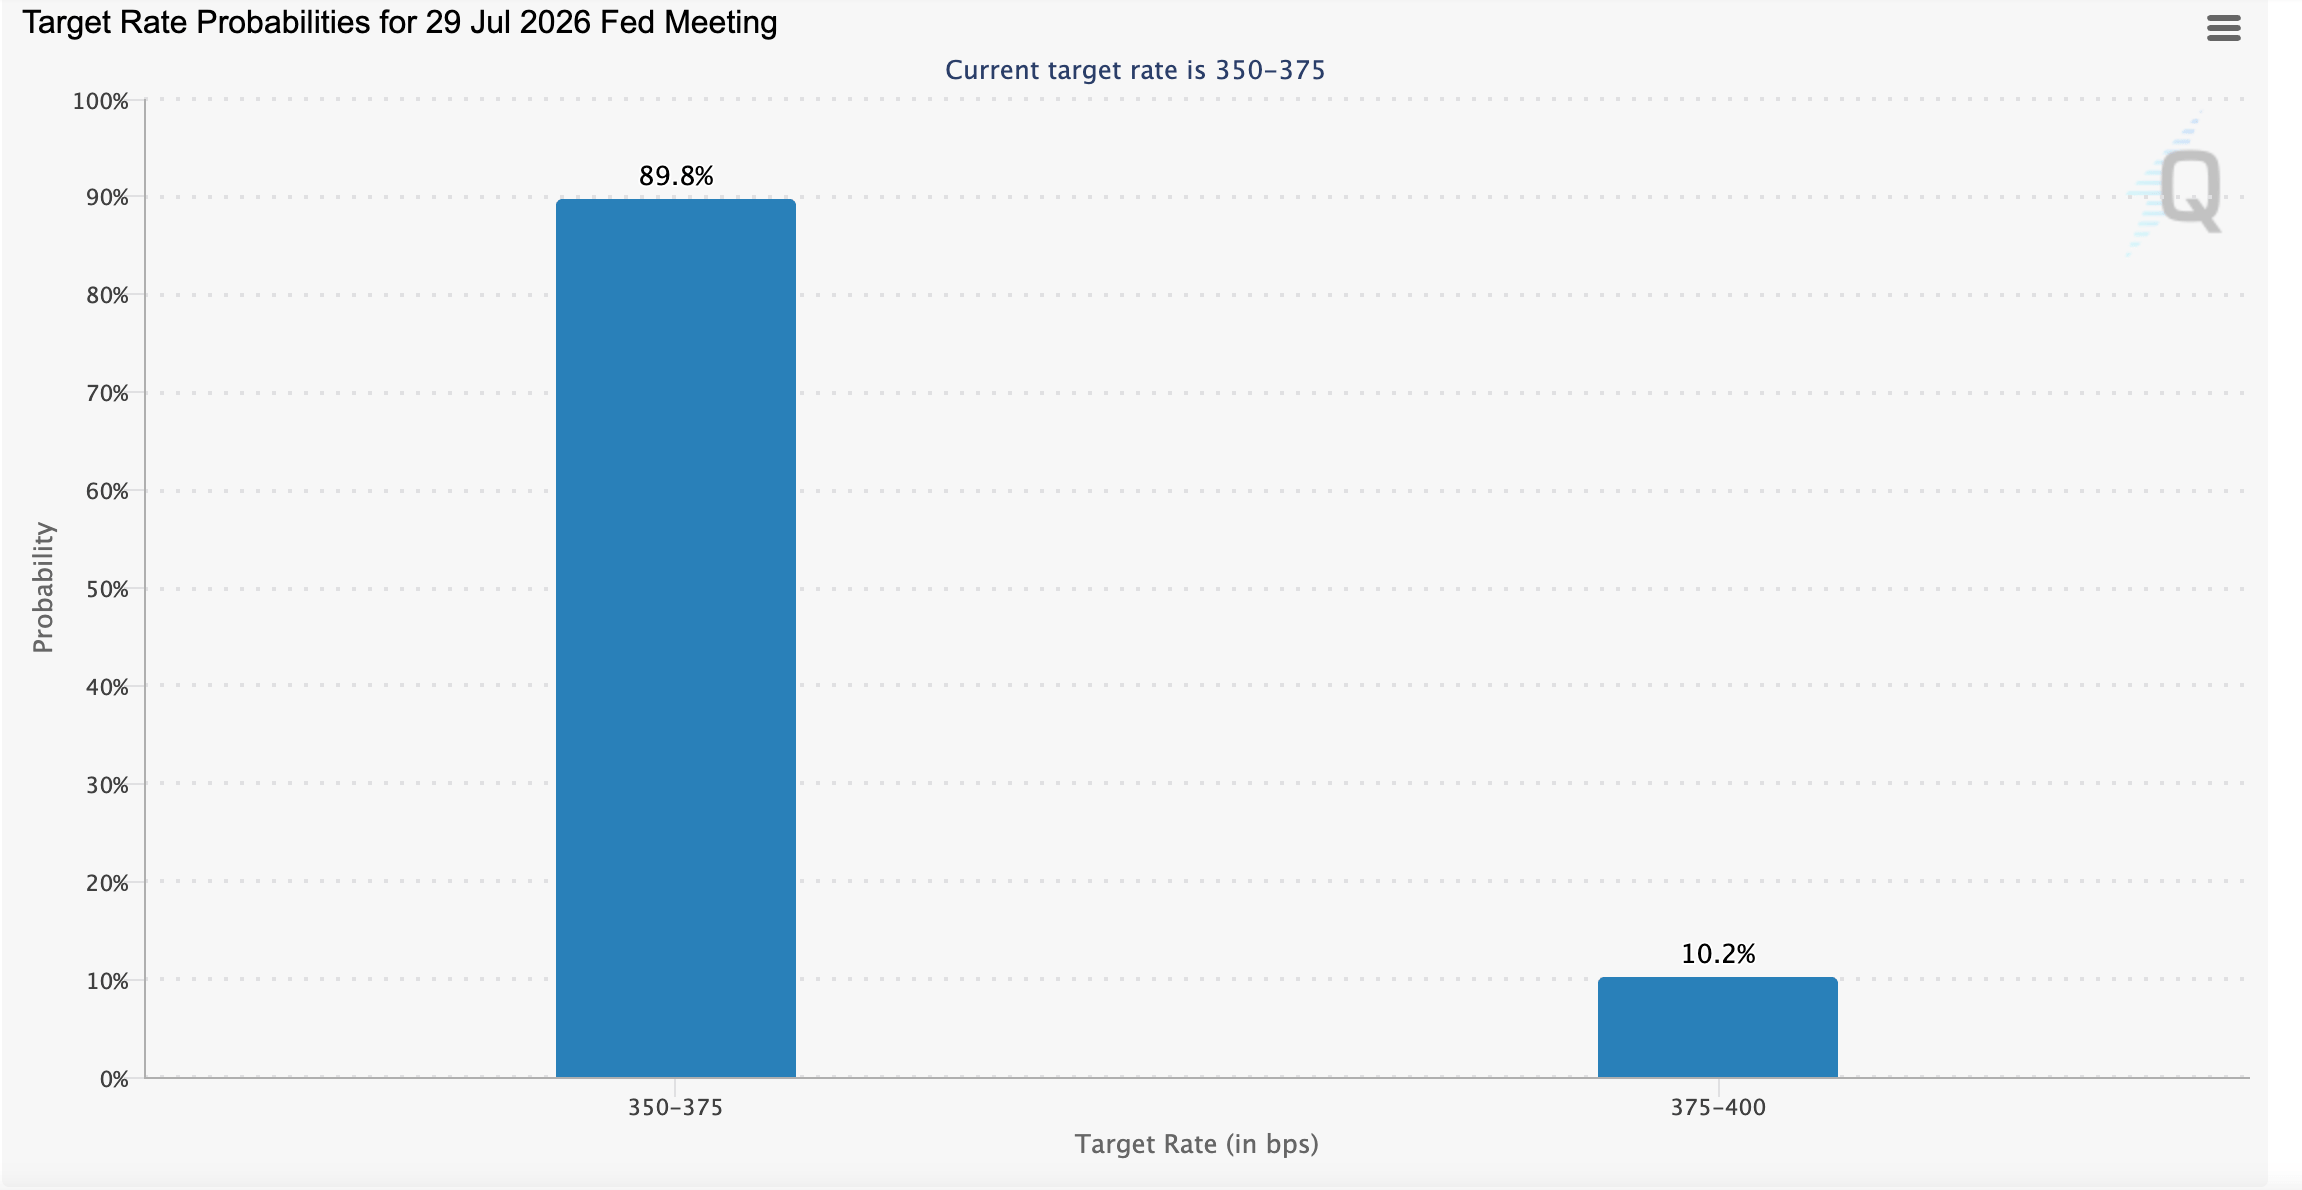
Market sentiment improved slightly, with investors currently pricing in an 90% probability that the Federal Reserve (US) will leave interest rates unchanged in the 3.50%-3.75% range at its next review cycle on July 29.
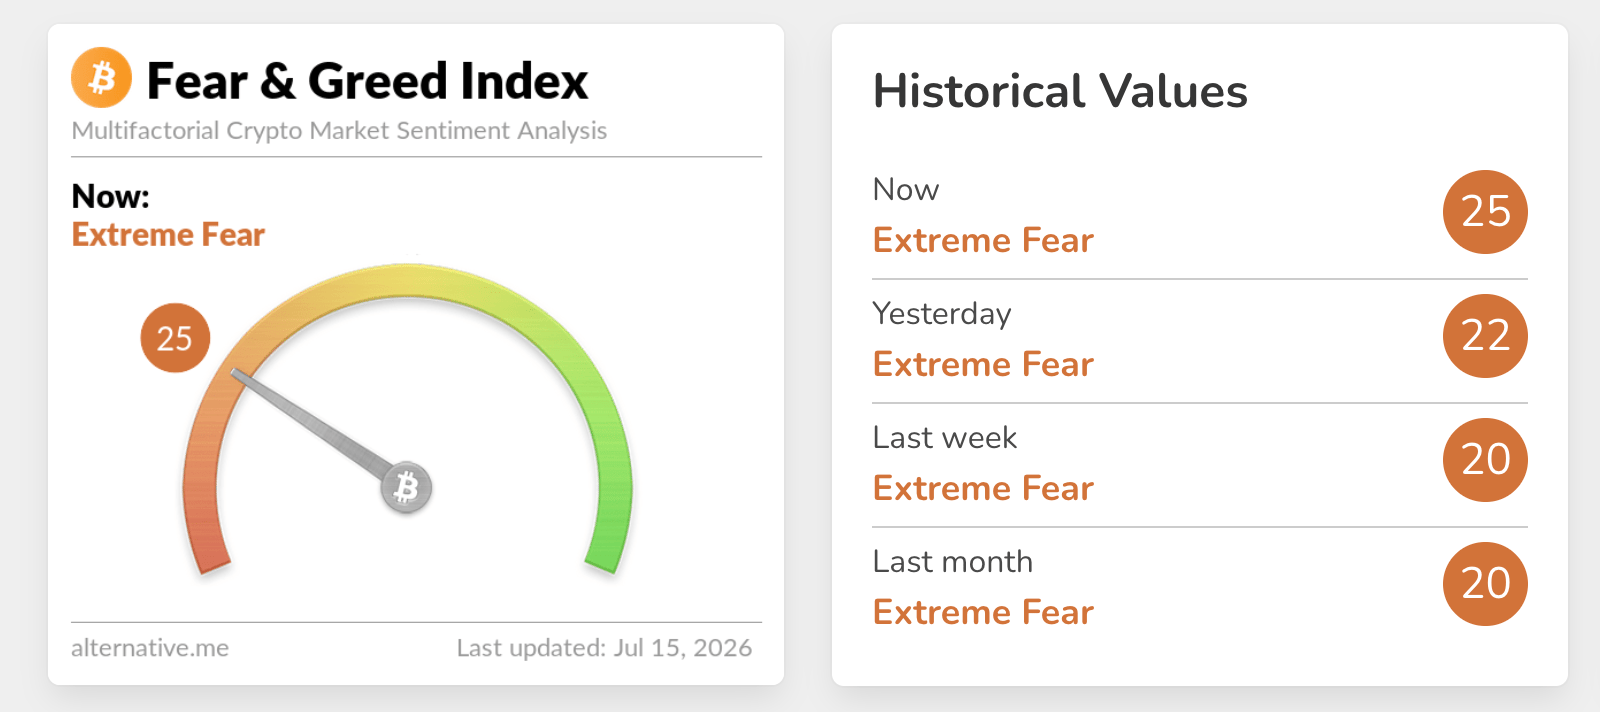
Appetite for crypto assets increased only marginally as reflected in the Fear & Greed Index. The index is embedded in the Extreme Fear territory at 25 on Wednesday, up from 22 the day before. If risk-on sentiment steadily increases, demand for risk assets, including XRP, would grow, intensifying the tailwind and supporting recovery in the short to medium term.
XRP absorbs supply as Binance reserves stabilize
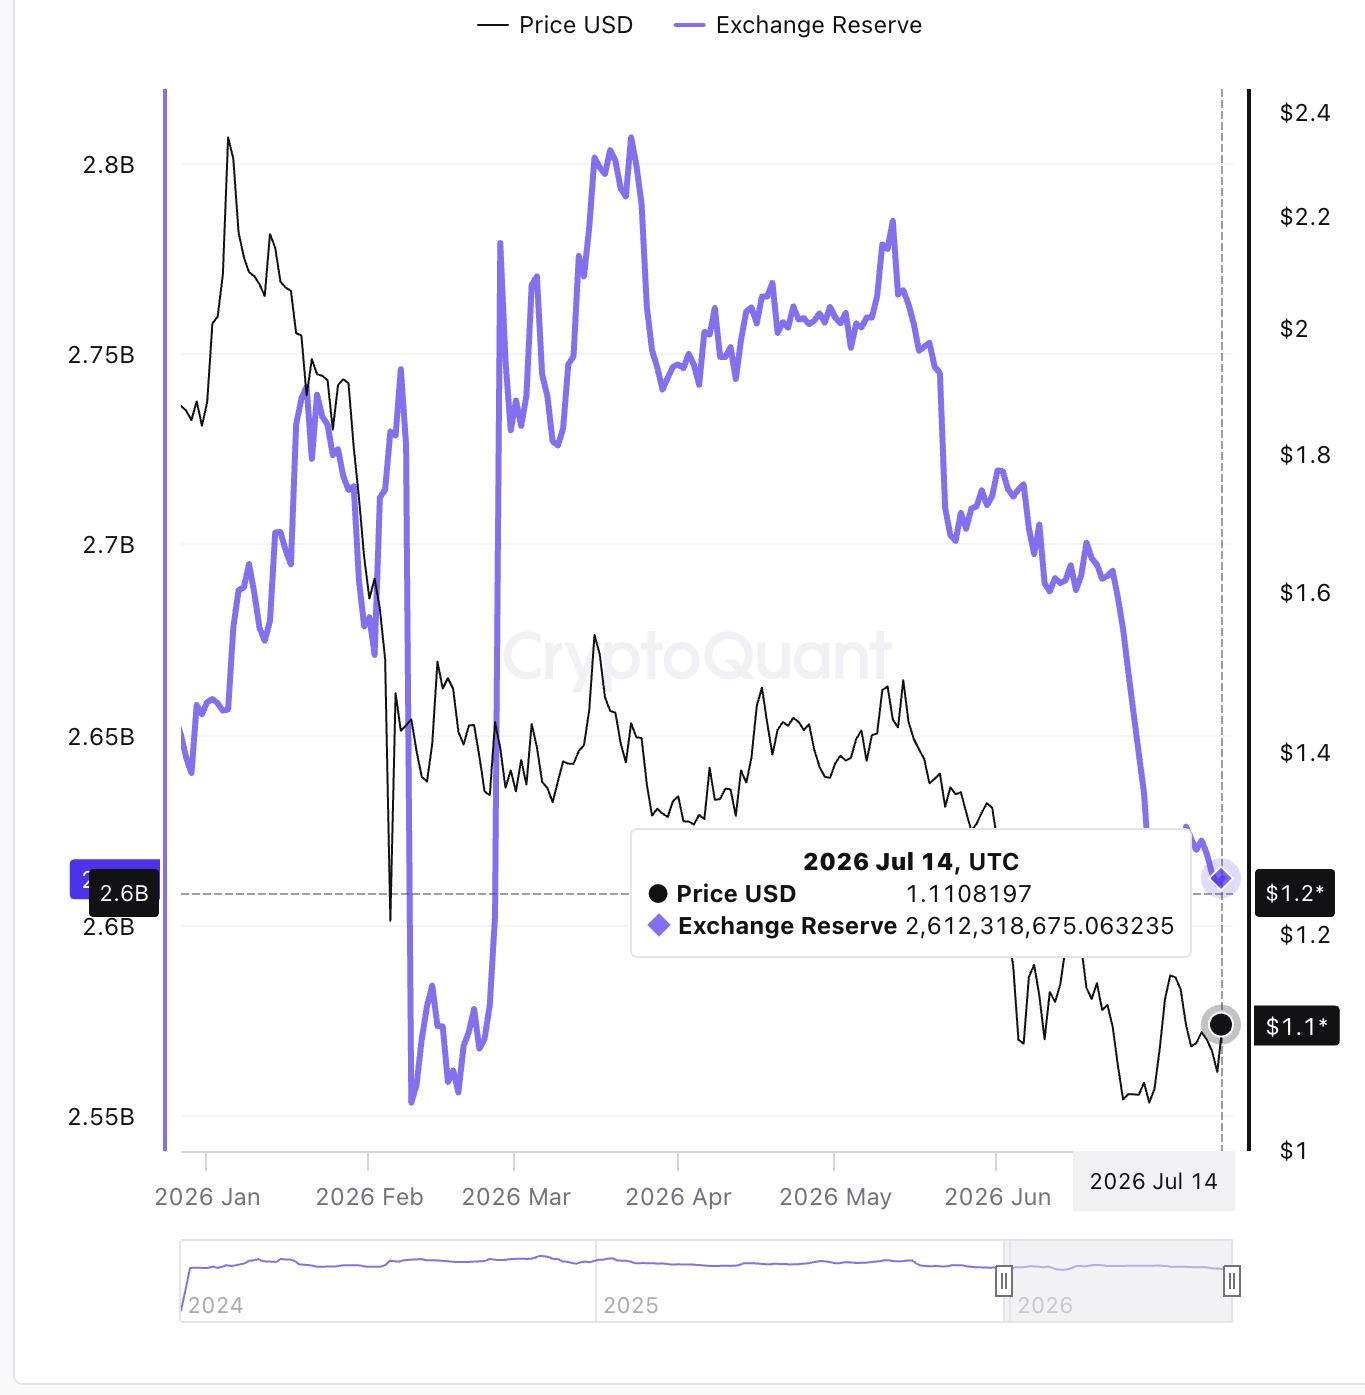
The number of tokens held in Binance wallets has remained relatively stable in July, averaging 2.61 billion XRP, valued at $2.9 billion on Wednesday. According to CryptoQuant data, the reserve’s stability indicates no major surge in immediate sell-side pressure.
If the price rises while exchange reserves fall or stay relatively flat, it often supports the notion that the market is absorbing supply. Hence, an increase in demand could boost XRP’s bullish outlook, paving the way for an extended rebound above $1.10.
Price analysis: XRP range-bound despite mild increase
XRP trades above $1.10, retaining a bearish near-term bias as it remains below the 50-day, 100-day and 200-day Moving Average Exponentials (EMAs), which fan out as layered resistance at $1.16, $1.26 and $1.46 respectively.
The Moving Average Convergence Divergence (MACD) indicator edges in positive territory on the daily chart and the Relative Strength Index (RSI) hovers near 49, suggesting only modest, indecisive momentum within a broader capped structure defined by the prevailing downward resistance trendline.
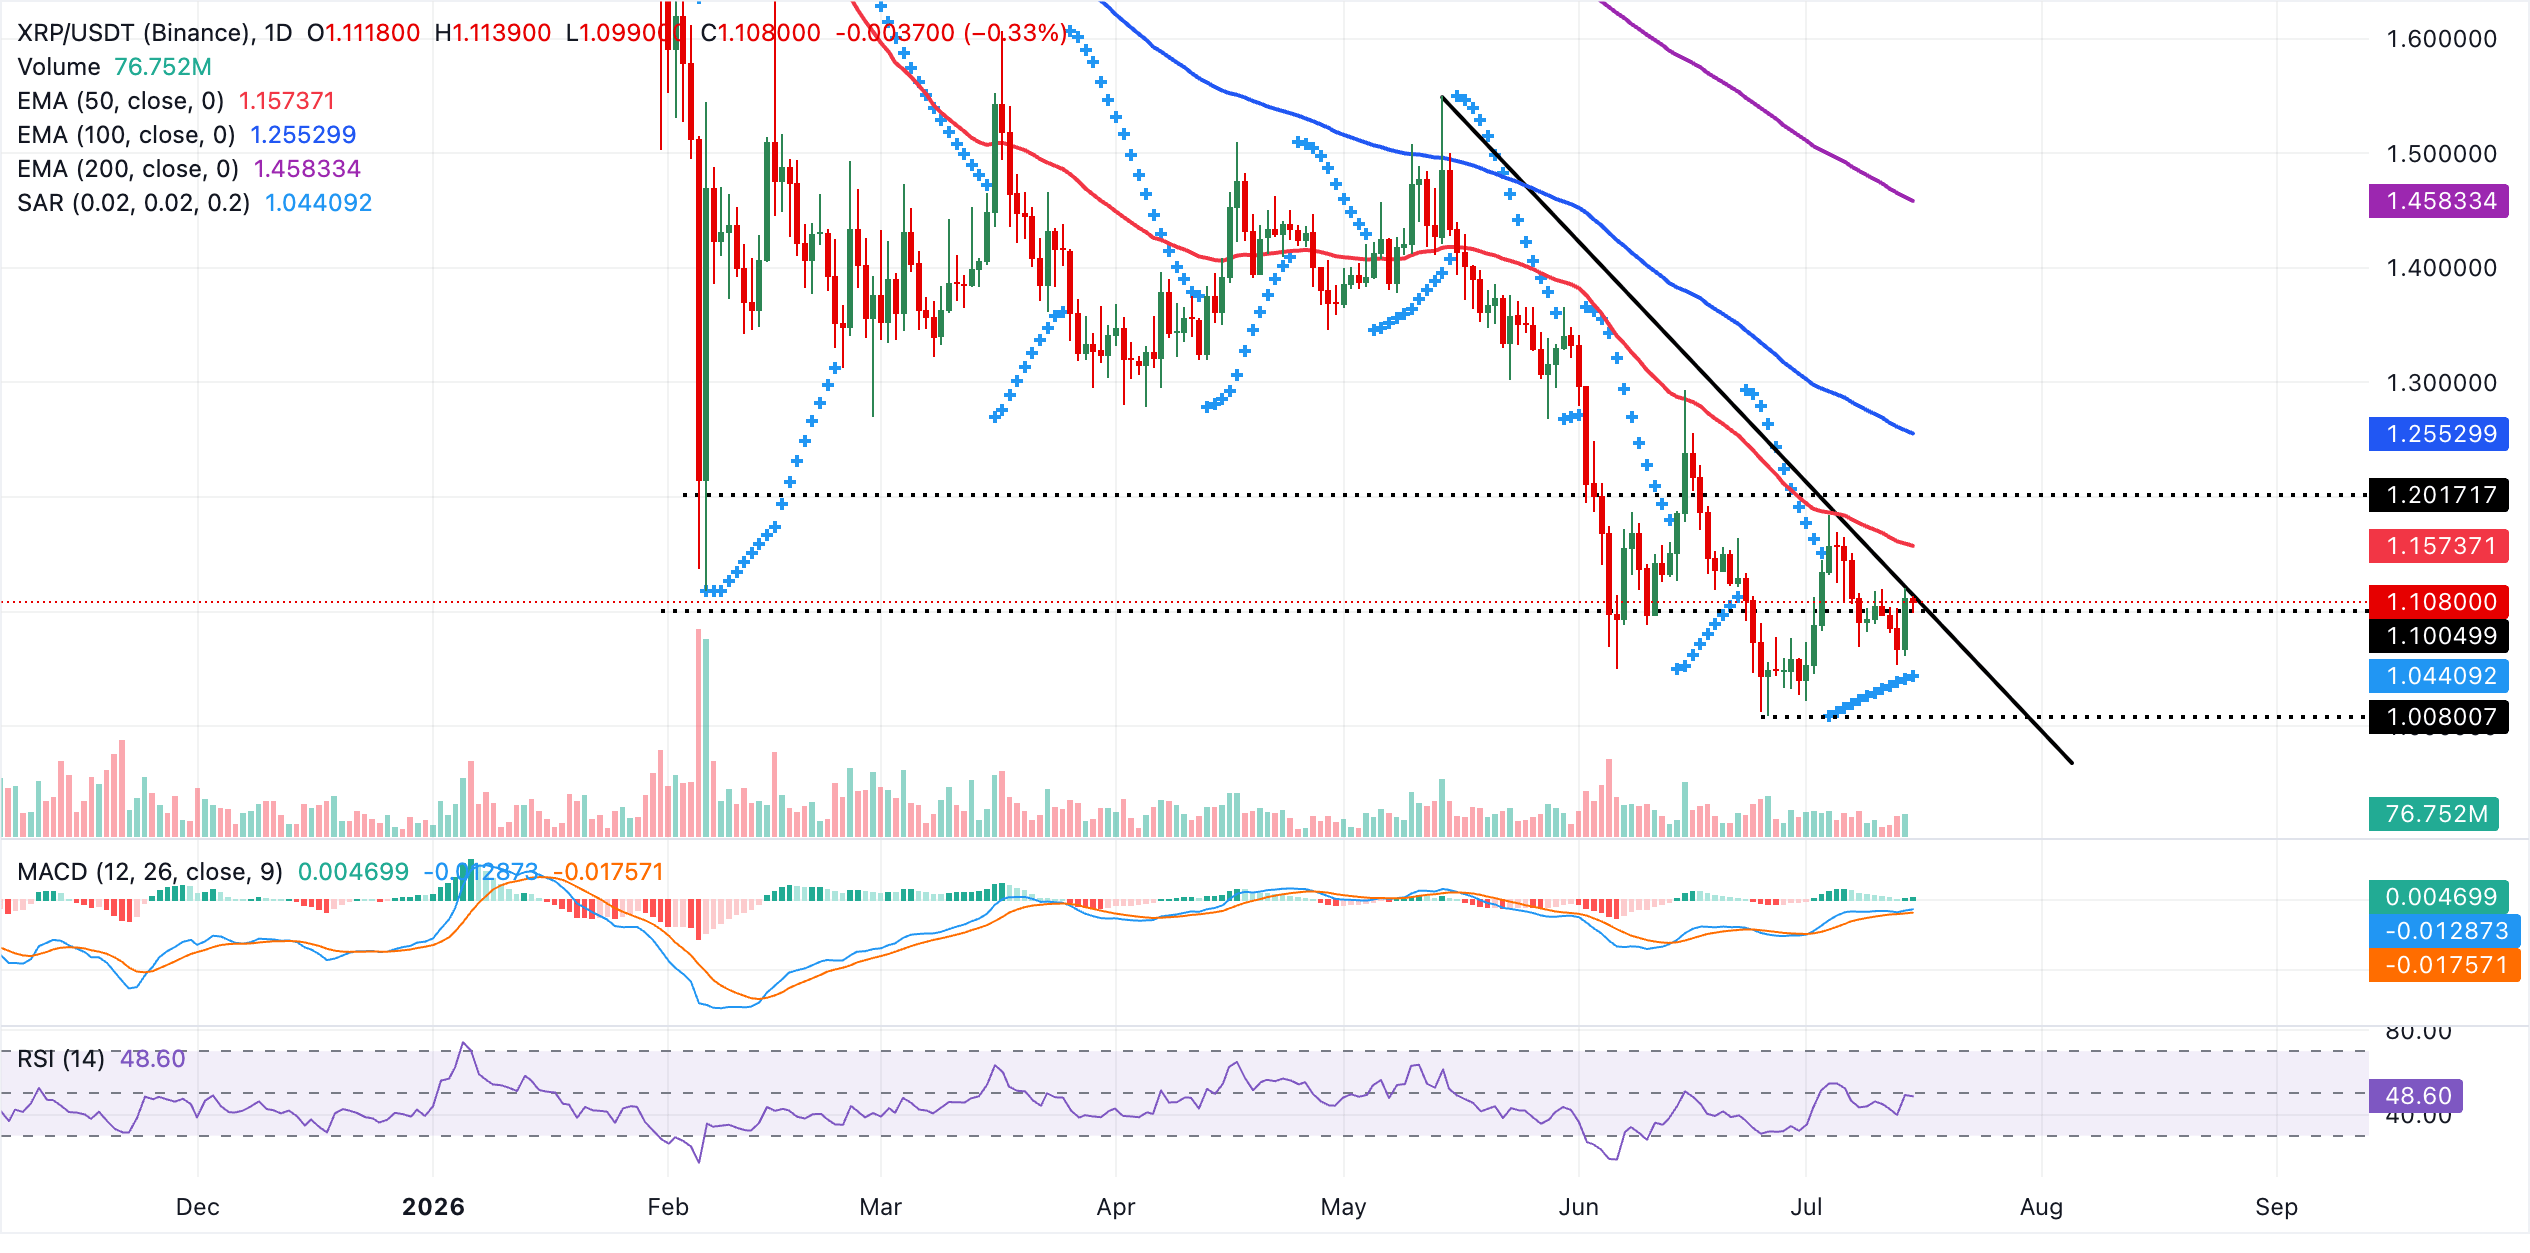
Initial resistance lies at the 50-day EMA around $1.16, with the 100-day EMA at $1.26 and the 200-day EMA near $1.46 reinforcing a wider bearish ceiling aligned with the descending trendline resistance overhead. Looking down, the first notable support emerges at the Parabolic SAR level near $1.04, and a clear break beneath this area would reopen scope for a deeper slide. Still, a recovery above the clustered moving average barriers would be needed to weaken the broader bearish bias.
(The technical analysis of this story was written with the help of an AI tool. Know more.)
Cryptocurrency metrics FAQs
The developer or creator of each cryptocurrency decides on the total number of tokens that can be minted or issued. Only a certain number of these assets can be minted by mining, staking or other mechanisms. This is defined by the algorithm of the underlying blockchain technology. On the other hand, circulating supply can also be decreased via actions such as burning tokens, or mistakenly sending assets to addresses of other incompatible blockchains.
Market capitalization is the result of multiplying the circulating supply of a certain asset by the asset’s current market value.
Trading volume refers to the total number of tokens for a specific asset that has been transacted or exchanged between buyers and sellers within set trading hours, for example, 24 hours. It is used to gauge market sentiment, this metric combines all volumes on centralized exchanges and decentralized exchanges. Increasing trading volume often denotes the demand for a certain asset as more people are buying and selling the cryptocurrency.
Funding rates are a concept designed to encourage traders to take positions and ensure perpetual contract prices match spot markets. It defines a mechanism by exchanges to ensure that future prices and index prices periodic payments regularly converge. When the funding rate is positive, the price of the perpetual contract is higher than the mark price. This means traders who are bullish and have opened long positions pay traders who are in short positions. On the other hand, a negative funding rate means perpetual prices are below the mark price, and hence traders with short positions pay traders who have opened long positions.














