
Silver Price Forecast: Can bulls defend $60 as the US Dollar climbs to one-year highs?
โดย Vishal Chaturvedi
อัปเดตแล้ว: 23 Jun 2026


บทความยอดนิยม

Silver (XAG/USD) slides more than 4% on Tuesday as the US Dollar (USD) climbs to near one-year highs after the Federal Reserve's (Fed) hawkish tilt at last week's monetary policy meeting reinforced expectations that interest rates will remain higher for longer.
- Silver slides more than 4% on Tuesday as hawkish Fed bets push the US Dollar to its highest level in nearly a year.
- XAG/USD's technical outlook remains bearish, with key support seen at the $60.00 psychological level.
- A break below $60.00 would expose deeper losses, while holding above the level would keep the broader range-bound structure intact.
Silver (XAG/USD) slides more than 4% on Tuesday as the US Dollar (USD) climbs to near one-year highs after the Federal Reserve's (Fed) hawkish tilt at last week's monetary policy meeting reinforced expectations that interest rates will remain higher for longer. At the time of writing, XAG/USD is trading around $61.96, near three-month lows.
The white metal remains in a correction phase following an extraordinary rally last year and is down nearly 50% from the all-time high near $121 reached in late January. However, in recent months, price action has been largely confined to a broad $60-$90 range.
Multiple rebounds from just above the $60 psychological level suggest buyers are attempting to defend the zone, although a stronger US Dollar and rising Treasury yields are threatening that support as markets price in the possibility of a Fed rate hike later this year.
A stronger US Dollar makes the metal more expensive for overseas buyers, while elevated Treasury yields increase the opportunity cost of holding non-yielding assets such as Silver.
US Personal Consumption Expenditures (PCE) inflation data due on Thursday could act as the next catalyst for Silver. A stronger-than-expected reading would likely boost the US Dollar further and strengthen bets on Fed rate hikes, leaving the white metal vulnerable to an extension of its downtrend. A softer reading, meanwhile, could pause the Greenback's advance and trigger a short-term recovery in XAG/USD.
Technical Analysis:
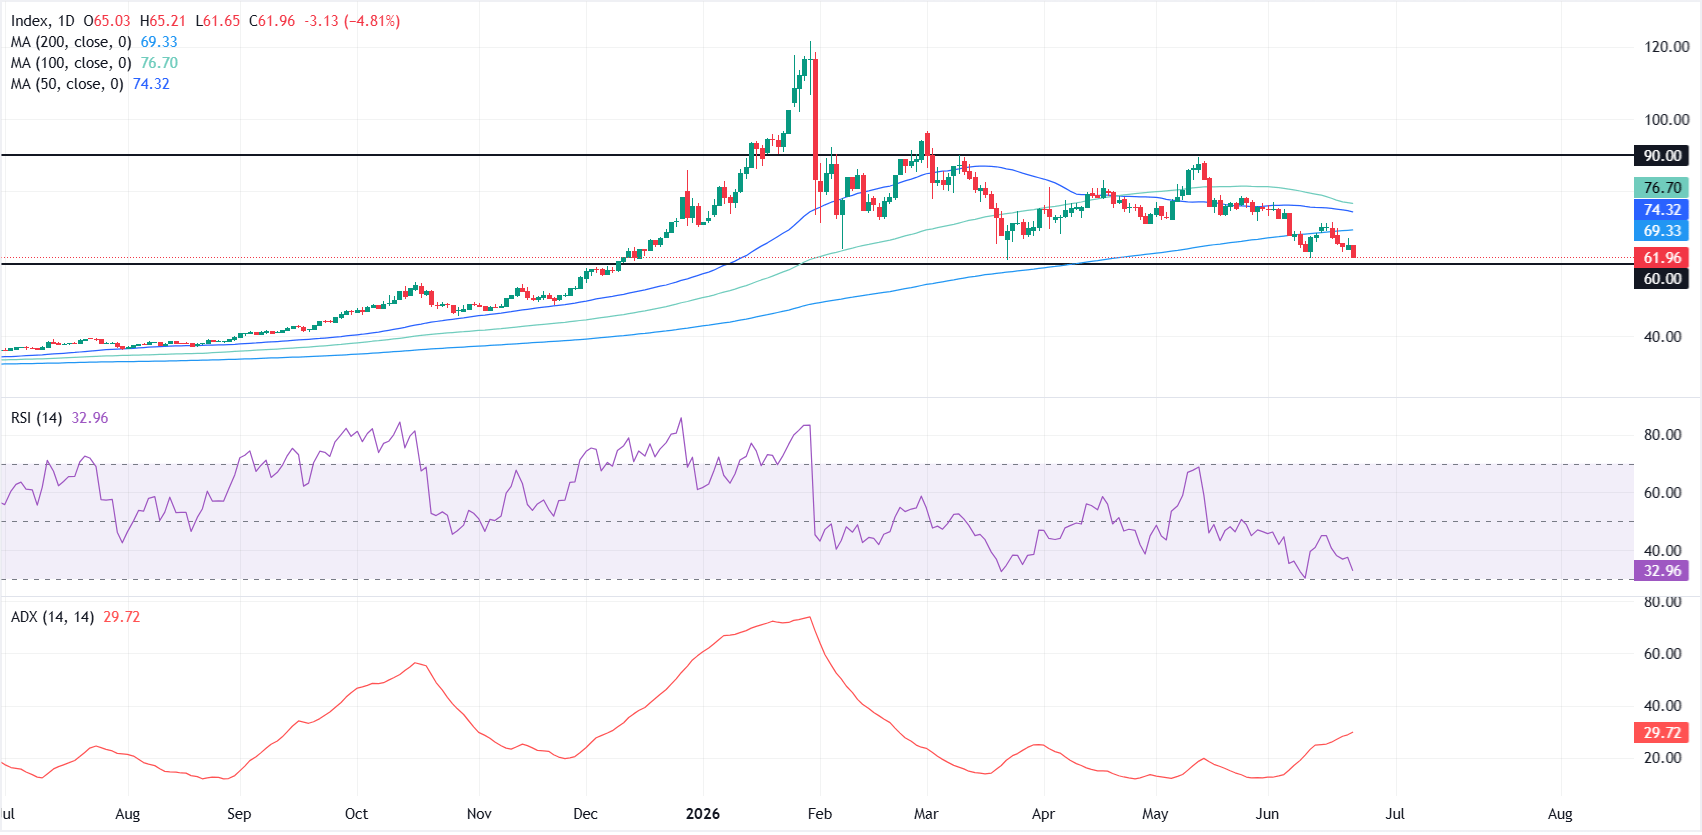
In the daily chart, XAG/USD is extending a bearish tone as price holds well beneath the 50-, 100- and 200-day Simple Moving Averages (SMAs), which all fan out overhead as a cap on recovery attempts.
Momentum remains weak, with the Relative Strength Index (RSI) hovering near the oversold band around 33, while the Average Directional Index (ADX) near 30 suggests a maturing but still active downtrend rather than capitulation.
On the topside, initial resistance is aligned with the 200-day SMA around $69.33, followed by the 50-day SMA near $74.33 and the 100-day SMA at about $76.70, before a more distant horizontal barrier at $90.00.
On the downside, the next key support is the horizontal floor at $60.00, where a break would open the way to further losses, while holding above it would merely signal consolidation within the broader bearish structure.
(The technical analysis of this story was written with the help of an AI tool.)
US Dollar Price Today
The table below shows the percentage change of US Dollar (USD) against listed major currencies today. US Dollar was the strongest against the Australian Dollar.
| USD | EUR | GBP | JPY | CAD | AUD | NZD | CHF | |
|---|---|---|---|---|---|---|---|---|
| USD | 0.32% | 0.30% | -0.05% | 0.21% | 1.00% | 0.70% | 0.06% | |
| EUR | -0.32% | -0.04% | -0.40% | -0.14% | 0.63% | 0.36% | -0.27% | |
| GBP | -0.30% | 0.04% | -0.34% | -0.08% | 0.70% | 0.40% | -0.22% | |
| JPY | 0.05% | 0.40% | 0.34% | 0.25% | 1.04% | 0.75% | 0.10% | |
| CAD | -0.21% | 0.14% | 0.08% | -0.25% | 0.80% | 0.50% | -0.14% | |
| AUD | -1.00% | -0.63% | -0.70% | -1.04% | -0.80% | -0.27% | -0.91% | |
| NZD | -0.70% | -0.36% | -0.40% | -0.75% | -0.50% | 0.27% | -0.65% | |
| CHF | -0.06% | 0.27% | 0.22% | -0.10% | 0.14% | 0.91% | 0.65% |
The heat map shows percentage changes of major currencies against each other. The base currency is picked from the left column, while the quote currency is picked from the top row. For example, if you pick the US Dollar from the left column and move along the horizontal line to the Japanese Yen, the percentage change displayed in the box will represent USD (base)/JPY (quote).

ผู้ใช้กว่าหนึ่งล้านคนพึ่งพา FXStreet สำหรับข้อมูลตลาดเรียลไทม์ เครื่องมือกราฟ การวิเคราะห์จากผู้เชี่ยวชาญ และข่าวฟอเร็กซ์ ปฏิทินเศรษฐกิจที่ครอบคลุมและเว็บบินาร์การศึกษาช่วยให้เทรดเดอร์ทันเหตุการณ์และตัดสินใจอย่างรอบคอบ FXStreet มีทีมงานประมาณ 60 คน แบ่งระหว่างสำนักงานใหญ่บาร์เซโลนาและภูมิภาคต่าง ๆ ทั่วโลก
อ่านเพิ่มเติม


