
Solana Price Analysis: SOL tests 50-day EMA with bullish on-chain and derivatives backdrop
โดย Manish Chhetri
อัปเดตแล้ว: 23 Apr 2026


บทความยอดนิยม

Solana (SOL) approaches a key technical hurdle near $87 on Thursday, and a breakout above this level would signal a bullish move ahead. Strengthening on-chain, improving derivatives data, and a constructive technical chart support a positive outlook for SOL in the near term.
- Solana nears its key 50-day EMA at $87 after gaining over 3% so far this week; a firm close suggests an upside move ahead.
- On-chain and derivatives data paint a bullish picture with large whale orders, cooling conditions and positive funding rates.
- The technical outlook remains constructive, as momentum indicators are strengthening, suggesting a near-term bullish move.
Solana (SOL) approaches a key technical hurdle near $87 on Thursday, and a breakout above this level would signal a bullish move ahead. Strengthening on-chain, improving derivatives data, and a constructive technical chart support a positive outlook for SOL in the near term.
On-chain and derivatives support a bullish case for SOL
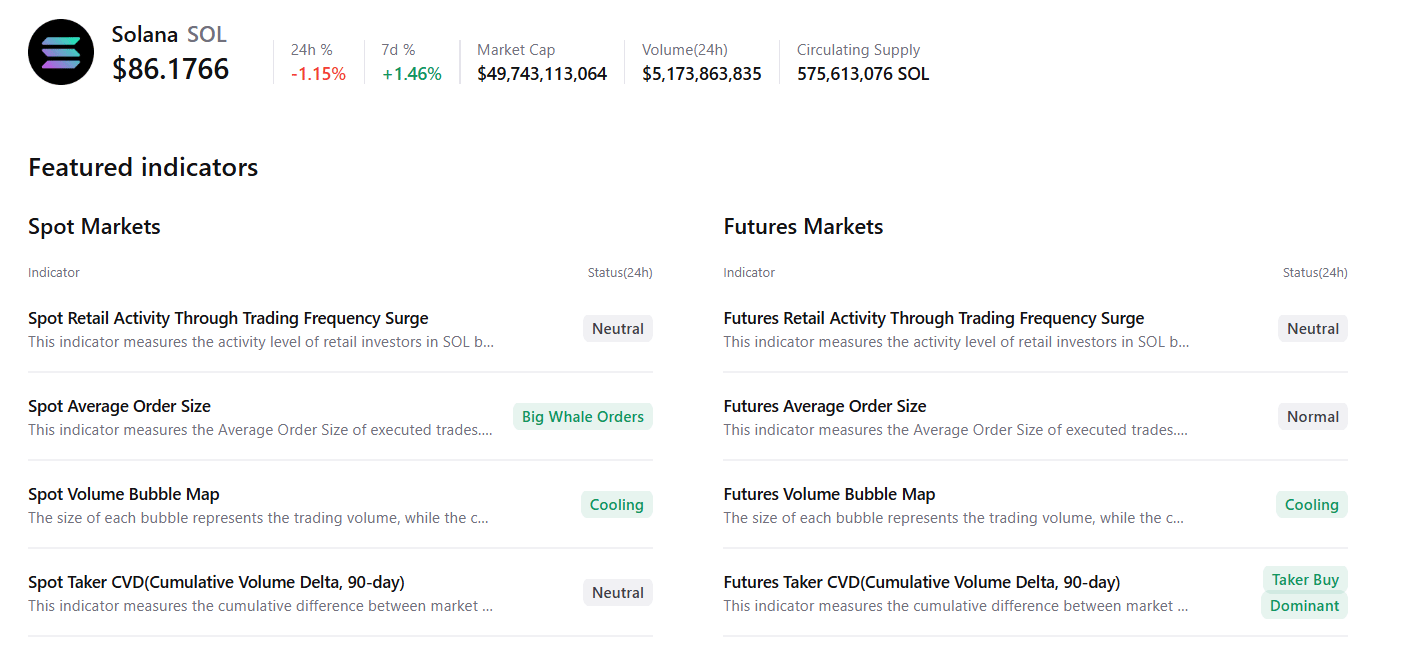
CryptoQuant summary data suggests a bullish outlook for Solana. SOL’s spot markets show the presence of large whale orders and cooling conditions, while the futures markets show buy-side dominance, suggesting a potential upside move.
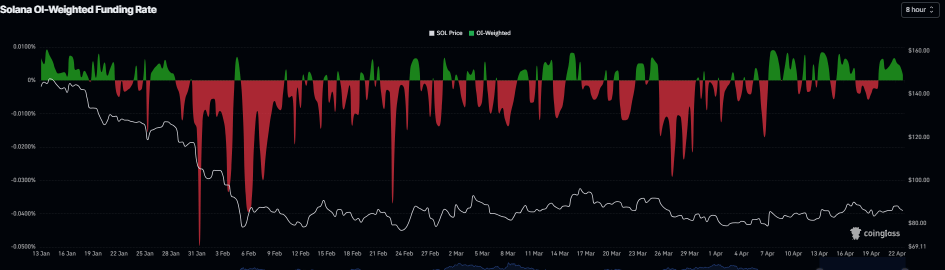
On the derivatives side, the funding rates also support a positive case. SOL’s funding rates flipped positive on Monday and rose to 0.0016% on Thursday, indicating that the longs are paying the shorts. Historically, when rates have turned positive and risen, the Solana price has surged sharply.
Solana Price Forecast: SOL near key resistance hurdle
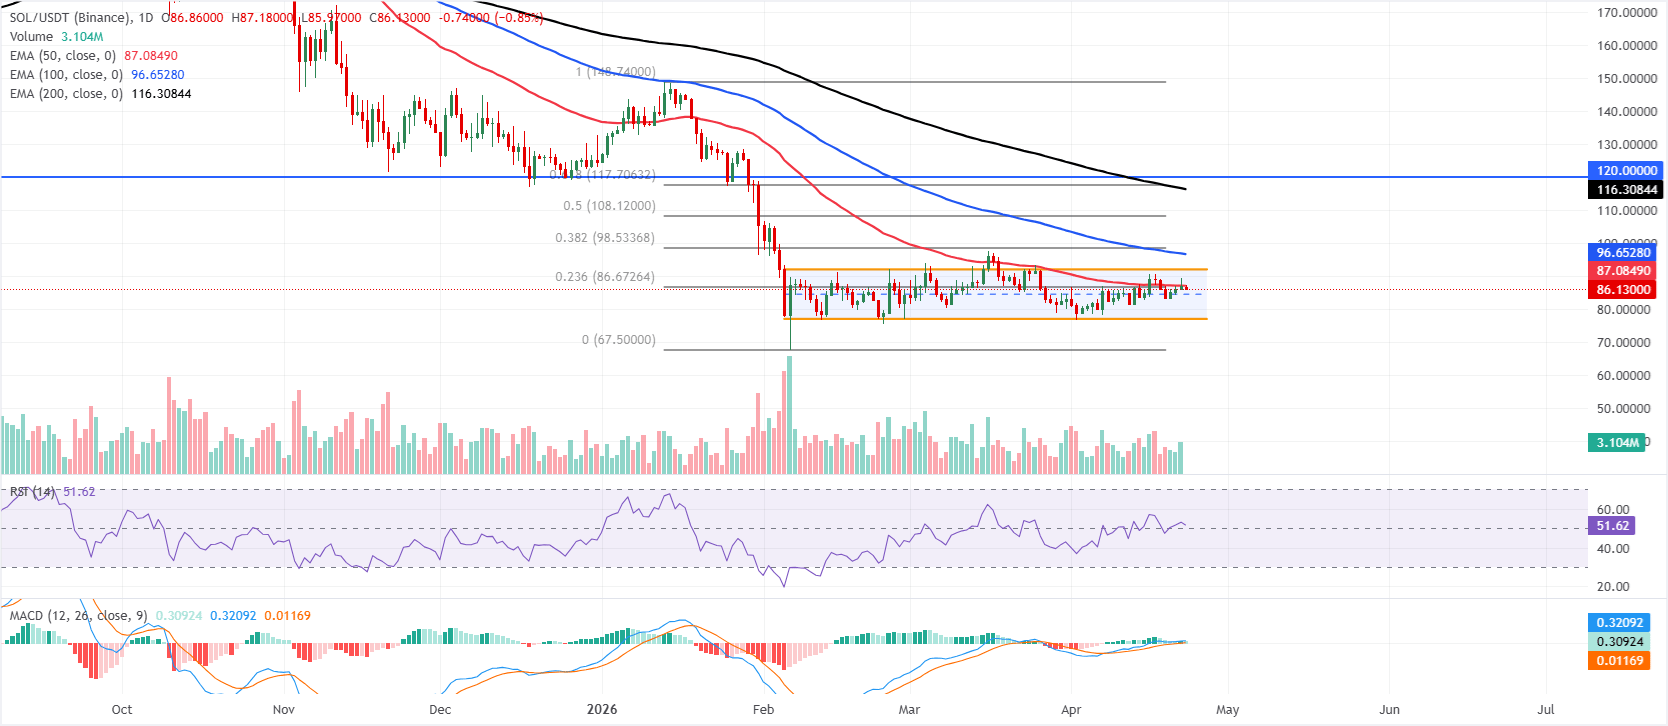
Solana price is trading at $86.13 on Thursday after three consecutive days of gains so far this week. However, the price action maintains a capped tone, holding within a parallel channel and below the 50-day, 100-day, and 200-day Exponential Moving Averages (EMAs). Immediate pressure comes from nearby resistance at the 23.6% Fibonacci retracement of the latest swing at $86.67 and the 50-day EMA at $87.08, which the pair has failed to reclaim so far.
The Relative Strength Index (RSI) on the daily chart hovers just above the 50 line while the Moving Average Convergence Divergence (MACD) remains marginally positive, hinting at modest bullish attempts that so far struggle against the prevailing overhead supply.
On the topside, initial resistance is seen at the $86.67 Fibonacci 23.6% level, followed by the 50-day EMA at $87.08, with a break higher exposing the channel top around $92.11 and then the 100-day EMA at $96.65, ahead of the denser retracement barrier near the 38.2% Fibonacci level at $98.53.
On the downside, the channel’s lower boundary around $77.12 provides the first notable support, with a decisive breakdown paving the way for the major Fibonacci anchor near $67.50.
(The technical analysis of this story was written with the help of an AI tool.)

ผู้ใช้กว่าหนึ่งล้านคนพึ่งพา FXStreet สำหรับข้อมูลตลาดเรียลไทม์ เครื่องมือกราฟ การวิเคราะห์จากผู้เชี่ยวชาญ และข่าวฟอเร็กซ์ ปฏิทินเศรษฐกิจที่ครอบคลุมและเว็บบินาร์การศึกษาช่วยให้เทรดเดอร์ทันเหตุการณ์และตัดสินใจอย่างรอบคอบ FXStreet มีทีมงานประมาณ 60 คน แบ่งระหว่างสำนักงานใหญ่บาร์เซโลนาและภูมิภาคต่าง ๆ ทั่วโลก
อ่านเพิ่มเติม


