
Top 3 Price Prediction: Bitcoin, Ethereum, Ripple – BTC gains traction, ETH consolidates, XRP turns bullish after channel breakout
โดย Manish Chhetri
อัปเดตแล้ว: 15 May 2026


บทความยอดนิยม

Bitcoin (BTC) and Ripple (XRP) prices trade slightly higher on Friday, while Ethereum (ETH) continues to consolidate around a key support zone. BTC rebounds after finding support at the key level hit the previous day, and ETH consolidates around its crucial 50-day EMA near $2,274.
- Bitcoin trades in green on Friday after rebounding from key support the previous day.
- Ethereum hovers around the key 50-day EMA at $2,274.
- XRP breaks above the descending channel, hinting at a bullish move ahead.
Bitcoin (BTC) and Ripple (XRP) prices trade slightly higher on Friday, while Ethereum (ETH) continues to consolidate around a key support zone. BTC rebounds after finding support at the key level hit the previous day, and ETH consolidates around its crucial 50-day EMA near $2,274. Meanwhile, XRP broke above the descending channel pattern, indicating growing bullish momentum and raising the possibility of further upside in the near term.
Bitcoin rebounds from key support
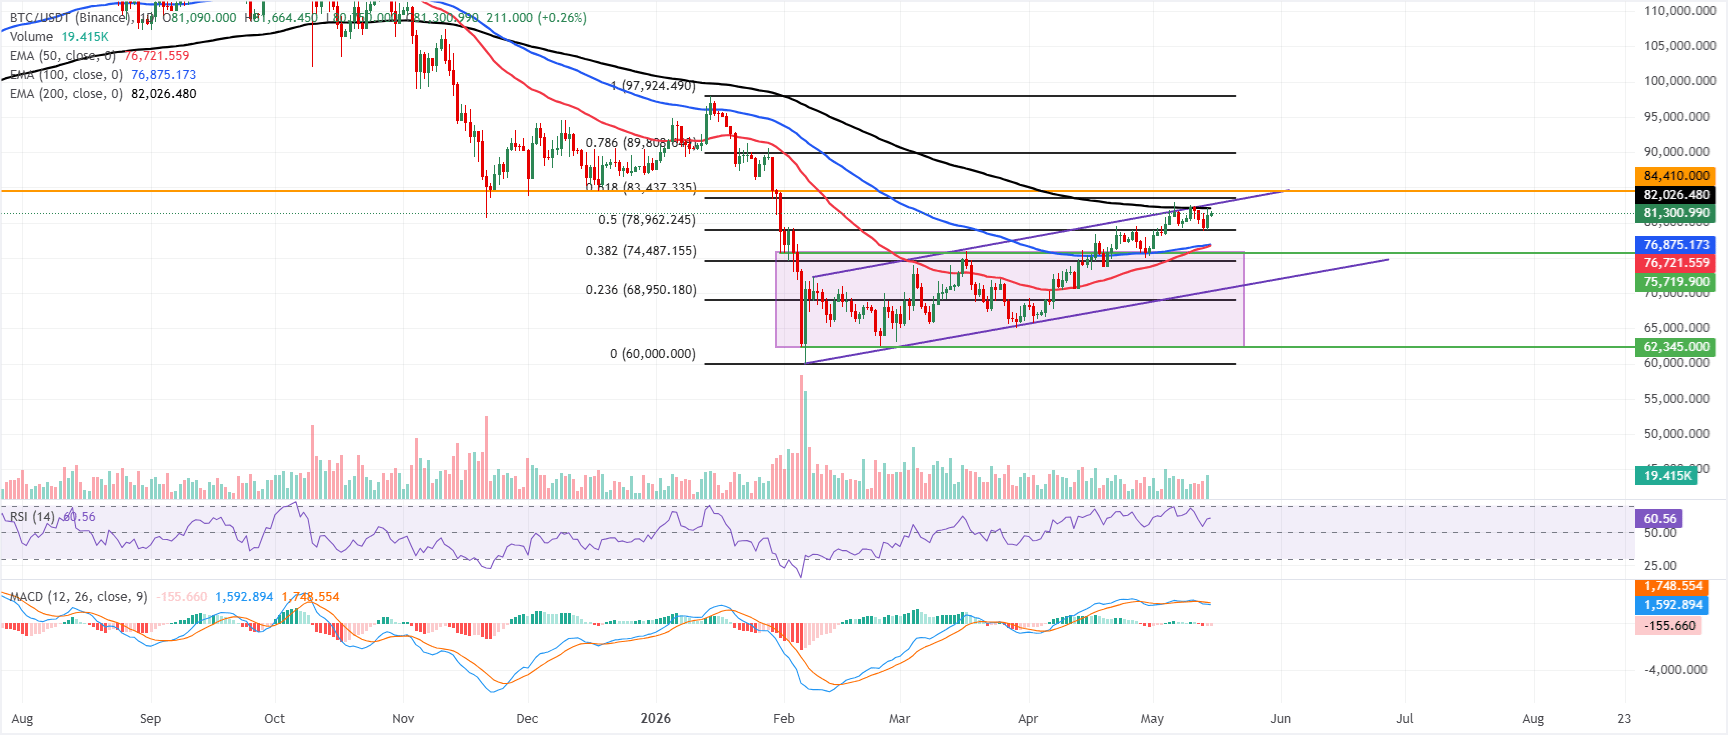
Bitcoin price is trading at $81,300 on Friday, maintaining a constructive bullish bias as it remains above the 50-day, 100-day, and 200-day Exponential Moving Averages (EMAs), which are clustered between roughly $76,700 and $82,000. This positioning suggests underlying dip-buying support despite the latest pullback from recent highs, though the Moving Average Convergence Divergence (MACD) turning more negative hints at waning upside momentum. At the same time, the Relative Strength Index (RSI) around 60 still points to positive but not overbought conditions.
On the topside, immediate resistance lies at the 61.8% Fibonacci retracement at $83,437 (drawn from the January high to the February low), followed by a horizontal barrier near $84,410, with the January high at $97,924 acting as a distant cap.
On the downside, initial support emerges at the 50% Fibonacci retracement at $78,962, with the 100-day and 50-day EMAs just below, and deeper protection from the 38.2% retracement at $74,487 toward the rising trendline region around $70,264.
Ethereum consolidates around the 50-day EMA
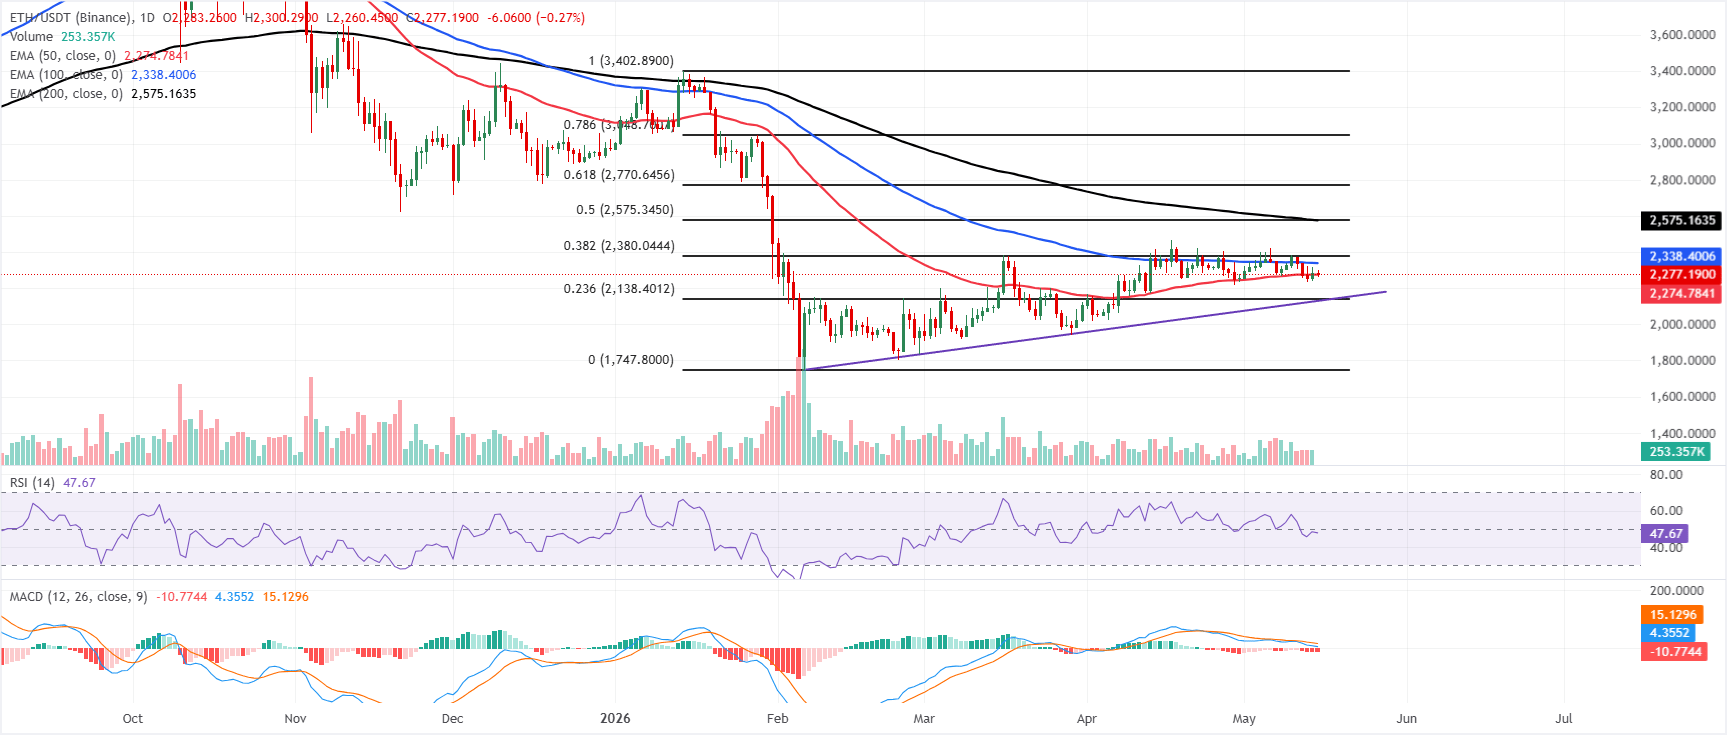
Ethereum is trading at $2,277 on Friday, holding just above the 50-day EMA at $2,274 but below the 100-day EMA at $2,338, leaving the pair in a neutral-to-capped near-term stance. The clustering of the 100-day EMA and the 38.2% Fibonacci retracement at $2,380 overhead suggests that rallies are facing a developing supply zone, while the RSI in the daily chart at 47 and the negative MACD on the same chart hint at fading bullish momentum after the recent recovery.
On the topside, immediate resistance is located at the 100-day EMA around $2,338, followed by the 38.2% Fibonacci retracement of the latest cycle at roughly $2,380; a daily close above this band would be needed to reopen the path toward the $2,575 region, where the 200-day EMA and the 50% retracement converge into a stronger medium-term barrier.
On the downside, initial support is provided by the 50-day EMA near $2,275, with a deeper pullback exposing the 23.6% retracement at $2,138 and the nearby trendline break area at $2,130, ahead of a more substantial structural floor around the $1,748 swing low.
XRP breaks above the descending channel
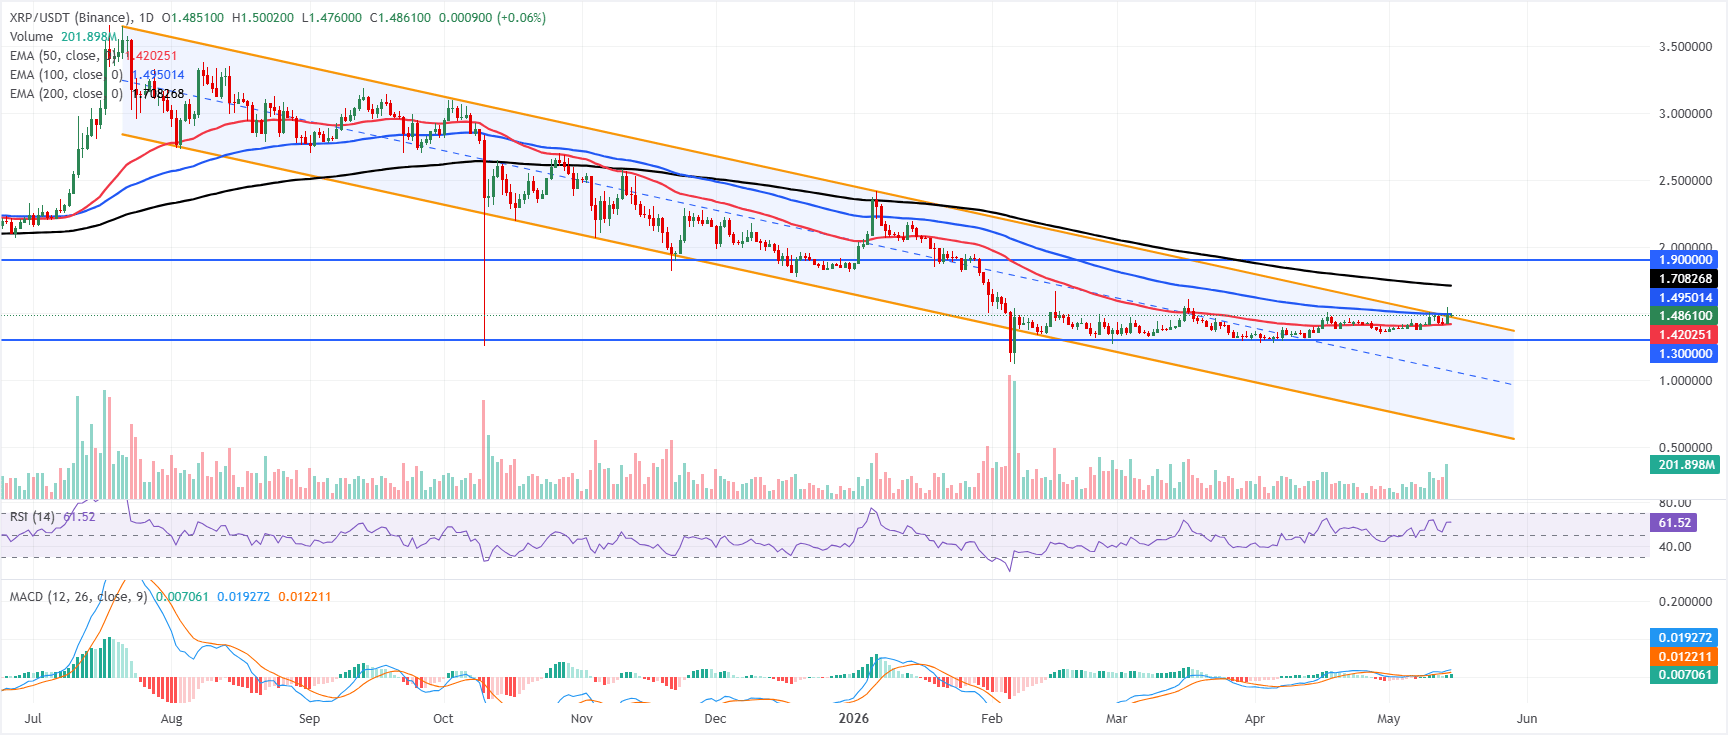
XRP price is trading above $1.48, maintaining a constructive near-term bullish bias as price holds above the 50-day EMA at $1.42 and has broken out over the prior descending channel reference around $1.47 on Thursday.
Momentum supports the upside tone, with the RSI on the daily chart near 62 and the MACD line turning positive, hinting that buyers remain in control while the pair trades beneath longer-term moving averages.
On the topside, immediate resistance is seen at the 100-day EMA around $1.49, and a sustained break above this cap would open the way toward the 200-day EMA near $1.70, ahead of the more distant horizontal barrier at $1.90.
On the downside, initial support is located near the recent breakout area at $1.47, followed by the 50-day EMA at $1.42. At the same time, a deeper pullback toward the $1.30 horizontal floor would likely attract dip-buying interest as long as the broader structure remains constructive.
(The technical analysis of this story was written with the help of an AI tool.)
Cryptocurrency prices FAQs
Token launches influence demand and adoption among market participants. Listings on crypto exchanges deepen the liquidity for an asset and add new participants to an asset’s network. This is typically bullish for a digital asset.
A hack is an event in which an attacker captures a large volume of the asset from a DeFi bridge or hot wallet of an exchange or any other crypto platform via exploits, bugs or other methods. The exploiter then transfers these tokens out of the exchange platforms to ultimately sell or swap the assets for other cryptocurrencies or stablecoins. Such events often involve an en masse panic triggering a sell-off in the affected assets.
Macroeconomic events like the US Federal Reserve’s decision on interest rates influence crypto assets mainly through the direct impact they have on the US Dollar. An increase in interest rate typically negatively influences Bitcoin and altcoin prices, and vice versa. If the US Dollar index declines, risk assets and associated leverage for trading gets cheaper, in turn driving crypto prices higher.
Halvings are typically considered bullish events as they slash the block reward in half for miners, constricting the supply of the asset. At consistent demand if the supply reduces, the asset’s price climbs.

ผู้ใช้กว่าหนึ่งล้านคนพึ่งพา FXStreet สำหรับข้อมูลตลาดเรียลไทม์ เครื่องมือกราฟ การวิเคราะห์จากผู้เชี่ยวชาญ และข่าวฟอเร็กซ์ ปฏิทินเศรษฐกิจที่ครอบคลุมและเว็บบินาร์การศึกษาช่วยให้เทรดเดอร์ทันเหตุการณ์และตัดสินใจอย่างรอบคอบ FXStreet มีทีมงานประมาณ 60 คน แบ่งระหว่างสำนักงานใหญ่บาร์เซโลนาและภูมิภาคต่าง ๆ ทั่วโลก
อ่านเพิ่มเติม


