
Top 3 Price Prediction: Bitcoin, Ethereum, Ripple – BTC recovers from fresh yearly low, ETH and XRP consolidate at key levels
โดย Manish Chhetri
อัปเดตแล้ว: 1 Jul 2026


บทความยอดนิยม

Bitcoin (BTC), Ethereum (ETH) and Ripple (XRP) are showing early signs of stabilization on Wednesday after a recent correction.
- Bitcoin falls to a fresh yearly low of $57,800 on Wednesday before recovering slightly.
- Ethereum stabilizes around the critical $1,500 support level as buyers attempt to halt the recent decline.
- XRP steadies around the key $1.00 psychological level as traders await the next directional catalyst.
Bitcoin (BTC), Ethereum (ETH) and Ripple (XRP) are showing early signs of stabilization on Wednesday after a recent correction. BTC rebounds modestly after falling to a fresh yearly low of $57,800, ETH holds above the critical $1,500 support level while XRP stabilizes around the key $1.00 psychological mark. The technical outlook for these top three cryptocurrencies is raising hopes of a short-term recovery after a massive price decline.
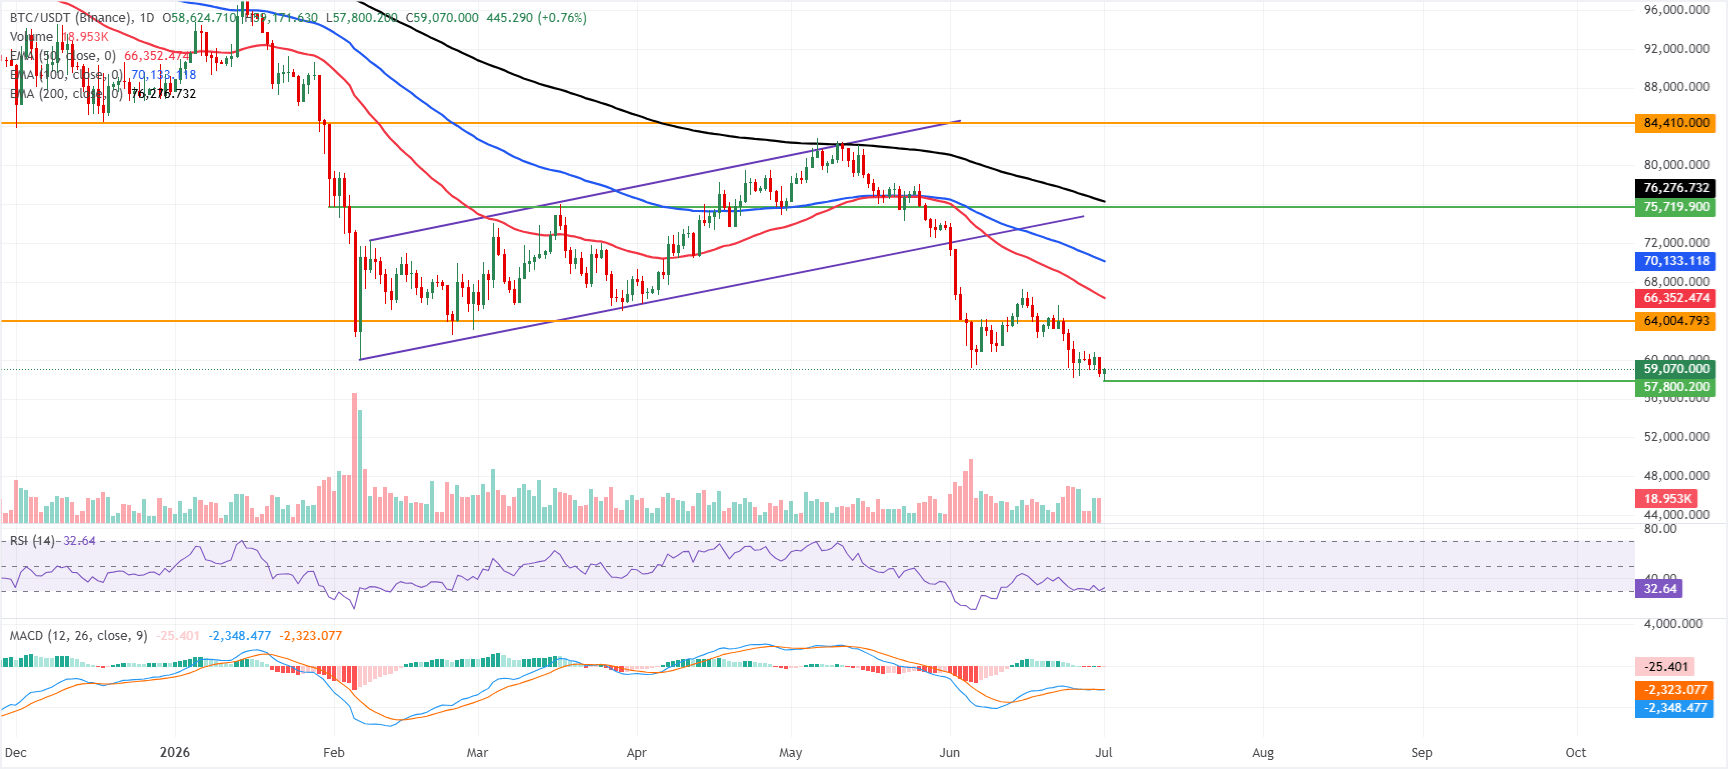
Bitcoin hits a new yearly low of $57,800
Bitcoin price is recovering slightly to $59,000 after hitting a new yearly low of $57,800 on Wednesday. BTC is extending its slide well below the key Exponential Moving Averages (EMAs), which keeps the bias firmly bearish. The 50-day EMA at $66,352, the 100-day EMA at $70,133 and the 200-day EMA at $76,276 all sit overhead, suggesting a market that remains capped by a dense band of medium- and long-term trend resistance.
The Relative Strength Index (RSI) on the daily chart hovers near 32, hinting at lingering weak momentum rather than a capitulation low. At the same time, the Moving Average Convergence Divergence (MACD) turns slightly negative again around the zero line, suggesting that the latest bounce is stalling under layered overhead supply.
On the topside, initial resistance emerges at the prior horizontal barrier around $64,004, ahead of the 50-day EMA near $66,352, with further recovery levels at the 100-day EMA at $70,133 and the 200-day EMA around $76,276.
A more substantial bullish reassessment would require a daily close above these clustered EMAs, while a failure to reclaim the $64,000 area would leave BTC vulnerable to a renewed downside extension targeting the key psychological level at $55,000.
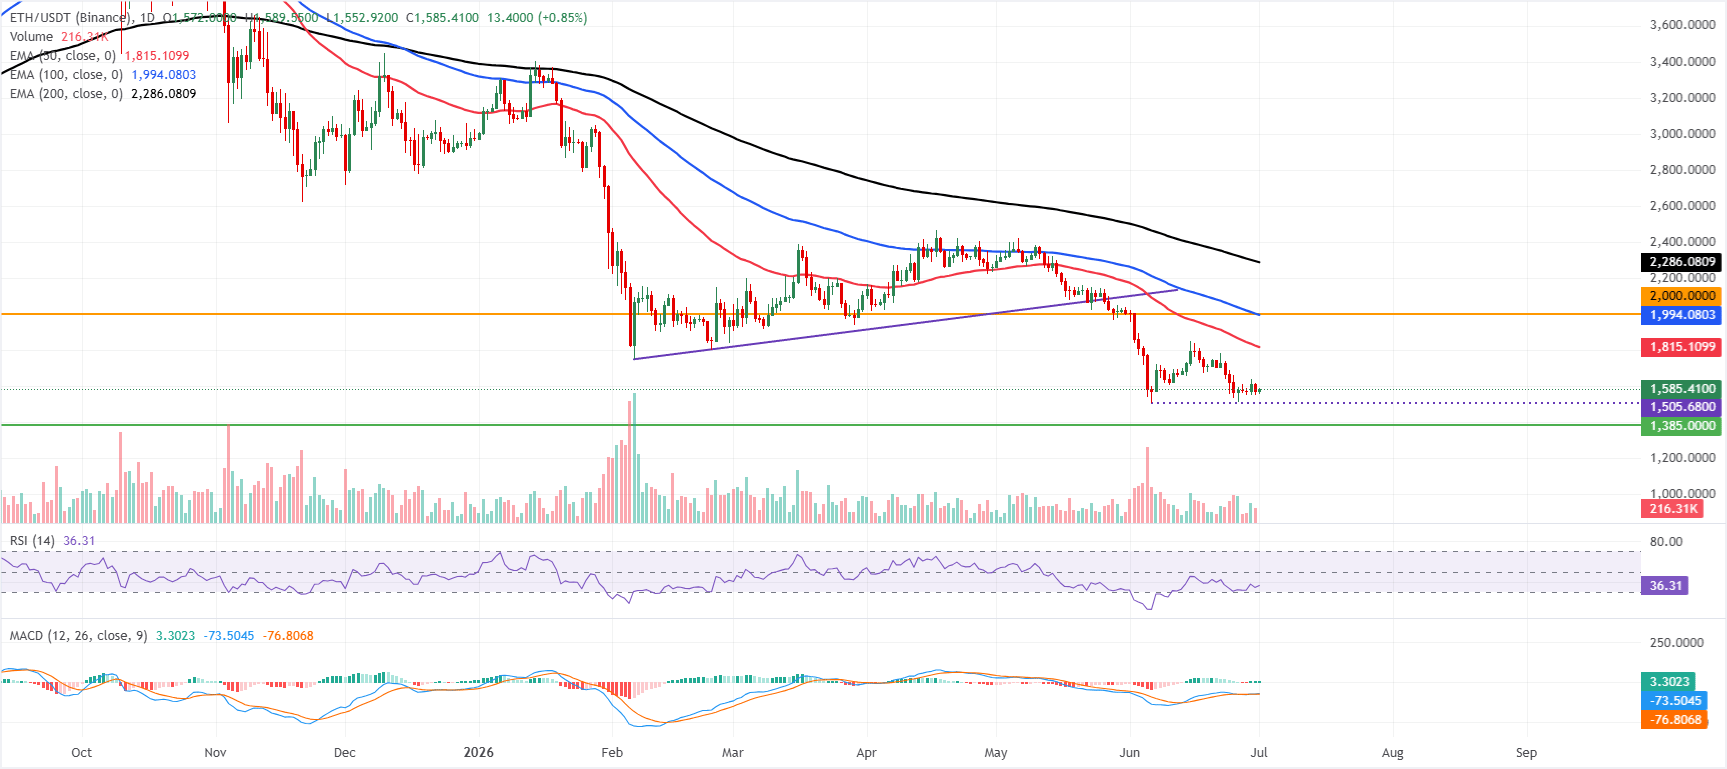
Ethereum holds strong above the $1,500 level
Ethereum price trades at $1,586 on Wednesday, holding above the key support zone at $1,500. However, ETH is maintaining a bearish bias, with price remaining well below the 50-day, 100-day, and 200-day EMAs, clustered between roughly $1,815 and $2,286.
The RSI hovers around 34, maintaining downside pressure, while a mildly positive MACD reading suggests a tentative loss of selling momentum rather than a clear bullish reversal.
On the topside, initial resistance emerges at the 50-day EMA near $1,814, with the 100-day EMA around $1,993 and the horizontal barrier at $2,000 forming a broader supply zone; beyond that, the 200-day EMA near $2,285 is a more strategic cap.
On the downside, the next notable support comes in at the horizontal level around $1,385, where buyers may attempt to stabilize the decline if the pair extends lower.
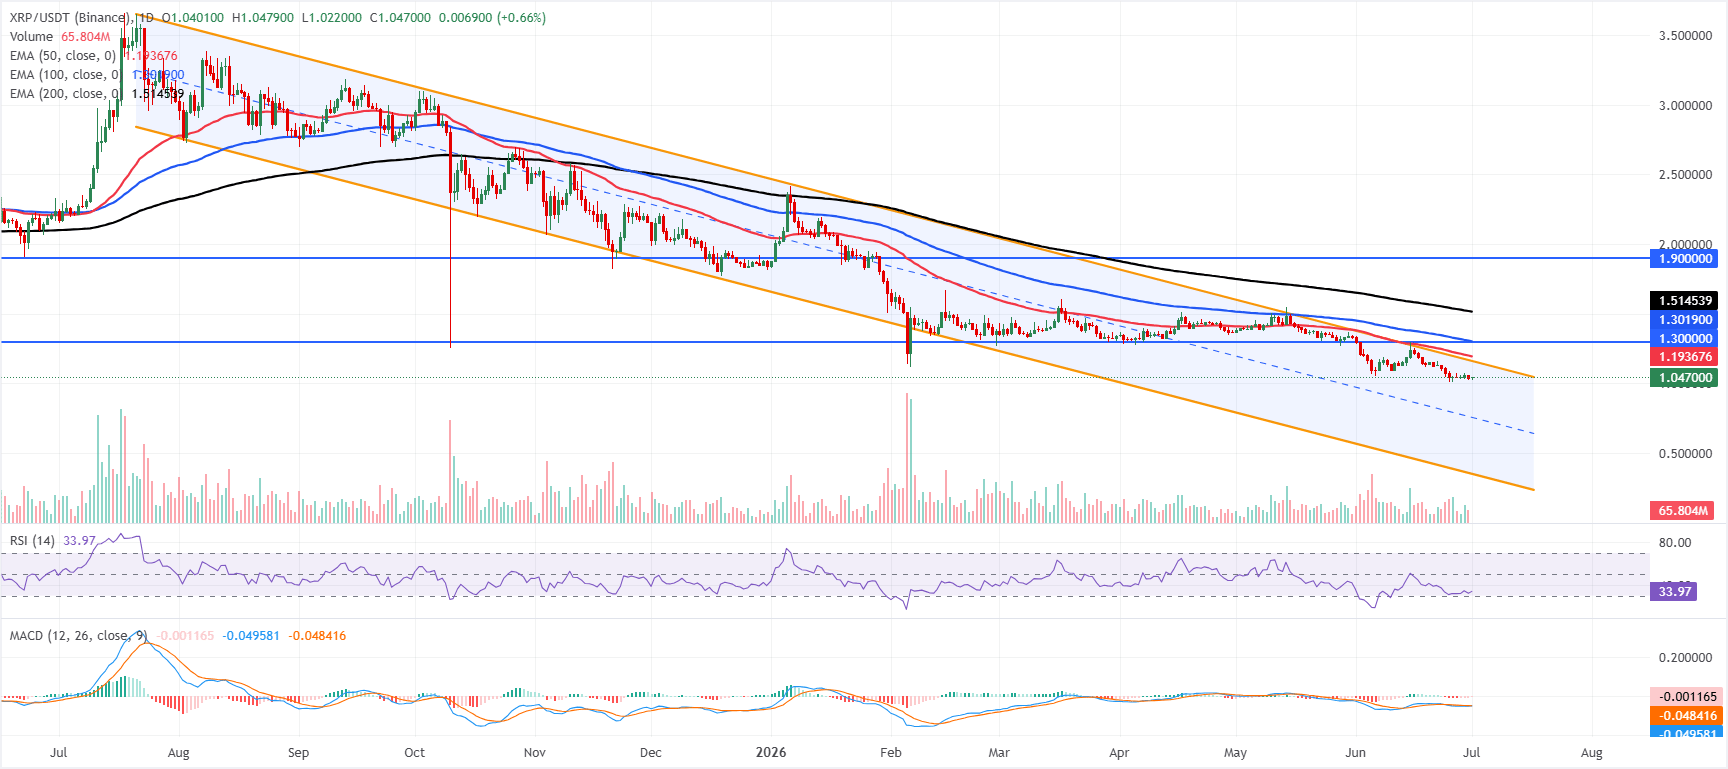
XRP steadies at key $1 mark
XRP price trades at $1.0471, maintaining a bearish near-term bias as it remains well below the 50-day, 100-day, and 200-day EMAs at $1.1937, $1.3019, and $1.5145, respectively. The pair also trades beneath the upper boundary of a downward parallel channel near $1.1597, underscoring a capped structure. At the same time, the RSI hovers around 34 and a slightly negative, flattening MACD histogram hints at weak but stabilizing downside momentum rather than an immediate reversal.
On the topside, initial resistance aligns with the channel boundary around $1.1600, followed by the 50-day EMA near $1.1937. Above these, the horizontal barrier at $1.3000 sits close to the 100-day EMA around $1.3019, forming a broader supply zone ahead of the more distant 200-day EMA near $1.5145 and the major horizontal resistance around $1.9000.
With no clear nearby structural support printed below the spot in this dataset, a daily close back above the $1.1600–$1.1900 band would be needed to ease immediate bearish pressure. At the same time, a failure to reclaim that cluster would keep the risk skewed toward further downside exploration.
(The technical analysis of this story was written with the help of an AI tool.)
Cryptocurrency prices FAQs
Token launches influence demand and adoption among market participants. Listings on crypto exchanges deepen the liquidity for an asset and add new participants to an asset’s network. This is typically bullish for a digital asset.
A hack is an event in which an attacker captures a large volume of the asset from a DeFi bridge or hot wallet of an exchange or any other crypto platform via exploits, bugs or other methods. The exploiter then transfers these tokens out of the exchange platforms to ultimately sell or swap the assets for other cryptocurrencies or stablecoins. Such events often involve an en masse panic triggering a sell-off in the affected assets.
Macroeconomic events like the US Federal Reserve’s decision on interest rates influence crypto assets mainly through the direct impact they have on the US Dollar. An increase in interest rate typically negatively influences Bitcoin and altcoin prices, and vice versa. If the US Dollar index declines, risk assets and associated leverage for trading gets cheaper, in turn driving crypto prices higher.
Halvings are typically considered bullish events as they slash the block reward in half for miners, constricting the supply of the asset. At consistent demand if the supply reduces, the asset’s price climbs.

ผู้ใช้กว่าหนึ่งล้านคนพึ่งพา FXStreet สำหรับข้อมูลตลาดเรียลไทม์ เครื่องมือกราฟ การวิเคราะห์จากผู้เชี่ยวชาญ และข่าวฟอเร็กซ์ ปฏิทินเศรษฐกิจที่ครอบคลุมและเว็บบินาร์การศึกษาช่วยให้เทรดเดอร์ทันเหตุการณ์และตัดสินใจอย่างรอบคอบ FXStreet มีทีมงานประมาณ 60 คน แบ่งระหว่างสำนักงานใหญ่บาร์เซโลนาและภูมิภาคต่าง ๆ ทั่วโลก
อ่านเพิ่มเติม


