
USD/CHF Price Forecast: Drops below 0.7800, bears target 0.7750
โดย Christian Borjon Valencia
อัปเดตแล้ว: 6 May 2026


บทความยอดนิยม

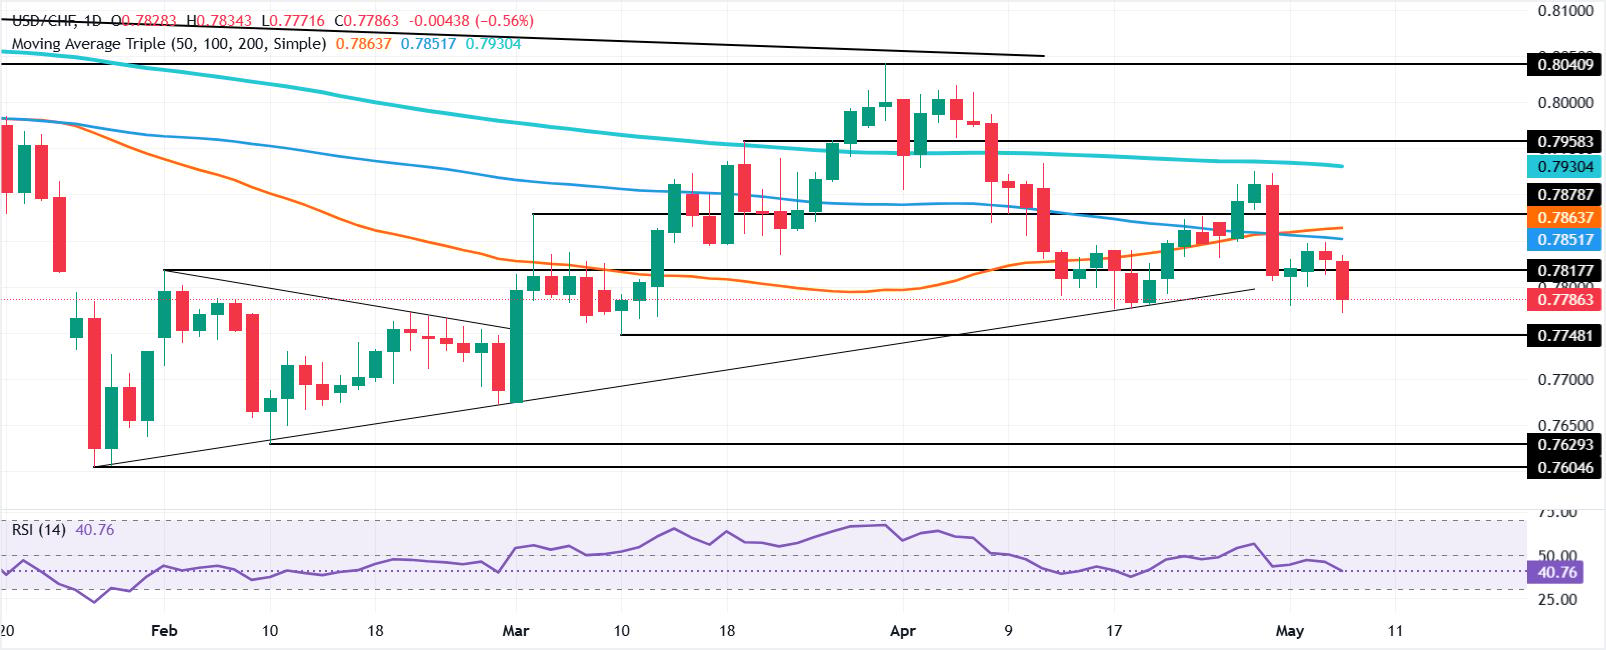
USD/CHF edges lower, breaching a key support trendline at around 0.7800 as the pair extends its downtrend, falling over 0.50% at the time of writing. The pair trades at 0.7789, as traders target the March 10 swing low at 0.7748.
- USD/CHF breaks below 0.7800, confirming continuation of bearish trend.
- RSI accelerates lower, signaling growing downside momentum pressure.
- Break below 0.7775 exposes 0.7748 and 0.7700 support levels.
USD/CHF edges lower, breaching a key support trendline at around 0.7800 as the pair extends its downtrend, falling over 0.50% at the time of writing. The pair trades at 0.7789, as traders target the March 10 swing low at 0.7748.
USD/CHF Price Forecast: Technical outlook
From a technical perspective, the downtrend is resuming after sellers cleared the 0.7800 figure. Worth noting that the USD/CHF tested the April 17 0.7775 cycle low, but the pair recovered some ground. However, a daily close below that level opens the door to testing lower areas, such as the March 10 daily low at 0.7748, ahead of 0.7700.
Momentum is bearishly biased, as indicated by the Relative Strength Index (RSI), and is accelerating towards oversold territory. This indicates that sellers are gathering momentum.
On the flip side, for a bullish continuation, buyers must reclaim 0.7800, followed by the confluence of the 20-, 100-, and 50-day Simple Moving Averages (SMAs) at around 0.7836/58. Once surpassed, the next area of interest will be the 0.7900 figure.
USD/CHF Price Chart – Daily
Swiss Franc Price This week
The table below shows the percentage change of Swiss Franc (CHF) against listed major currencies this week. Swiss Franc was the strongest against the Canadian Dollar.
| USD | EUR | GBP | JPY | CAD | AUD | NZD | CHF | |
|---|---|---|---|---|---|---|---|---|
| USD | -0.03% | 0.03% | -0.19% | 0.32% | -0.34% | -0.99% | -0.22% | |
| EUR | 0.03% | 0.04% | -0.18% | 0.37% | -0.26% | -0.95% | -0.15% | |
| GBP | -0.03% | -0.04% | -0.21% | 0.30% | -0.31% | -1.00% | -0.21% | |
| JPY | 0.19% | 0.18% | 0.21% | 0.57% | -0.10% | -0.68% | -0.03% | |
| CAD | -0.32% | -0.37% | -0.30% | -0.57% | -0.64% | -1.26% | -0.51% | |
| AUD | 0.34% | 0.26% | 0.31% | 0.10% | 0.64% | -0.69% | 0.10% | |
| NZD | 0.99% | 0.95% | 1.00% | 0.68% | 1.26% | 0.69% | 0.80% | |
| CHF | 0.22% | 0.15% | 0.21% | 0.03% | 0.51% | -0.10% | -0.80% |
The heat map shows percentage changes of major currencies against each other. The base currency is picked from the left column, while the quote currency is picked from the top row. For example, if you pick the Swiss Franc from the left column and move along the horizontal line to the US Dollar, the percentage change displayed in the box will represent CHF (base)/USD (quote).

ผู้ใช้กว่าหนึ่งล้านคนพึ่งพา FXStreet สำหรับข้อมูลตลาดเรียลไทม์ เครื่องมือกราฟ การวิเคราะห์จากผู้เชี่ยวชาญ และข่าวฟอเร็กซ์ ปฏิทินเศรษฐกิจที่ครอบคลุมและเว็บบินาร์การศึกษาช่วยให้เทรดเดอร์ทันเหตุการณ์และตัดสินใจอย่างรอบคอบ FXStreet มีทีมงานประมาณ 60 คน แบ่งระหว่างสำนักงานใหญ่บาร์เซโลนาและภูมิภาคต่าง ๆ ทั่วโลก
อ่านเพิ่มเติม


