
USD/CHF stays above 200-day SMA as inverse head-and-shoulders is intact
โดย Christian Borjon Valencia
อัปเดตแล้ว: 17 Jun 2026


บทความยอดนิยม

The USD/CHF remains steady on Wednesday as market participants await the US central bank's monetary policy decision, with the Federal Reserve expected to hold rates unchanged. At the time of writing, the pair trades at 0.7932, flattish.
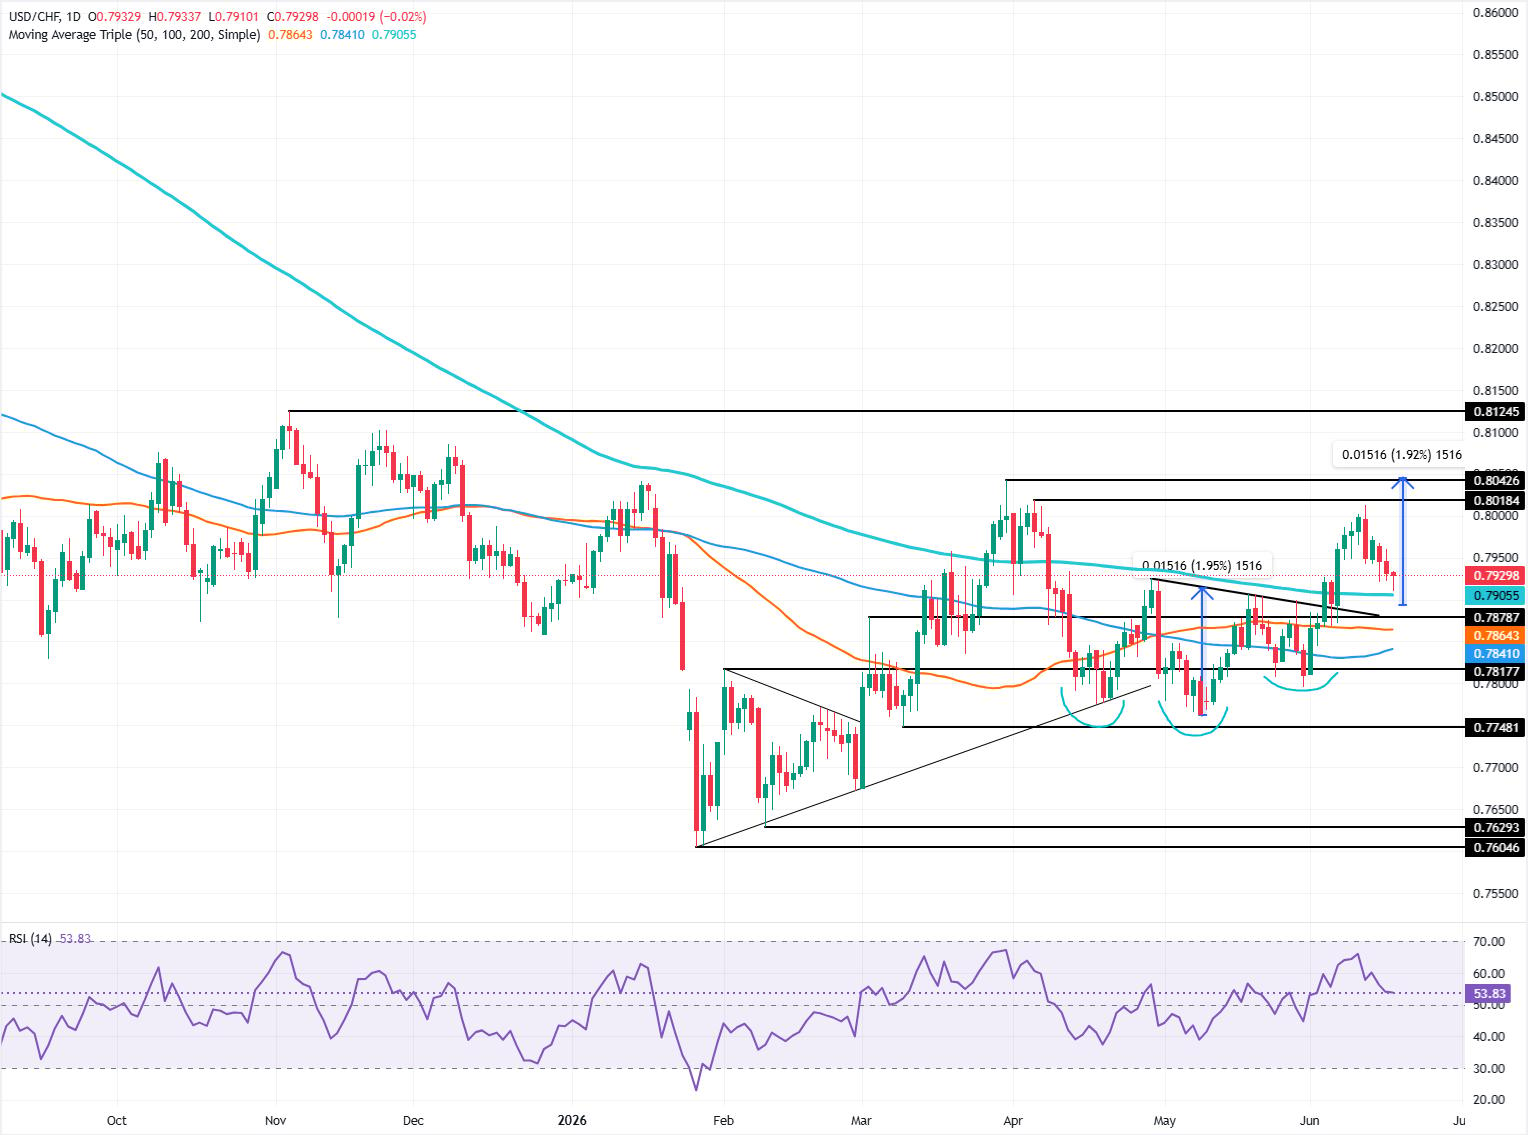
- USD/CHF holds inverse head-and-shoulders above 200-day SMA support.
- Flat RSI slope signals indecision despite bullish momentum backdrop.
- Break above 0.7950 exposes 0.8013 and 0.8042 resistance.
The USD/CHF remains steady on Wednesday as market participants await the US central bank's monetary policy decision, with the Federal Reserve expected to hold rates unchanged. At the time of writing, the pair trades at 0.7932, flattish.
USD/CHF Price Forecast: Technical outlook
Price action shows that the ‘inverse head-and-shoulders’ remains intact, with the USD/CHF spot price sitting above the 200-day Simple Moving Average (SMA) at 0.7905, usually sought for investors and algos, as a trend-setter signal in the long term.
The Relative Strength Index (RSI) shows that momentum is bullish, though the index’s slope is horizontal, an indication of indecision amongst traders.
Above, the USD/CHF's first key resistance is the 0.7950 psychological level, followed by the June 11 swing high at 0.8013. Once hurdled, the next stop would be the March 31 high of 0.8042, which is also the ‘inverse head-and-shoulders’ measured target, ahead of 0.8050.
On the flip side, if the pair slides below the 200-day SMA, it opens the door to clear the 0.7900 figure. A breach of the latter will expose the confluence of the 50-day SMA and the June 4 daily low of 0.7868, followed by the 100-day SMA at 0.7841. Below these levels lies the 0.7800 figure.
USD/CHF Price Chart – Daily
Swiss Franc Price Today
The table below shows the percentage change of Swiss Franc (CHF) against listed major currencies today. Swiss Franc was the strongest against the Canadian Dollar.
| USD | EUR | GBP | JPY | CAD | AUD | NZD | CHF | |
|---|---|---|---|---|---|---|---|---|
| USD | 0.14% | 0.23% | -0.16% | 0.26% | -0.09% | 0.24% | -0.07% | |
| EUR | -0.14% | 0.09% | -0.26% | 0.11% | -0.24% | 0.12% | -0.20% | |
| GBP | -0.23% | -0.09% | -0.36% | 0.03% | -0.29% | 0.03% | -0.25% | |
| JPY | 0.16% | 0.26% | 0.36% | 0.40% | 0.06% | 0.34% | 0.12% | |
| CAD | -0.26% | -0.11% | -0.03% | -0.40% | -0.34% | -0.01% | -0.28% | |
| AUD | 0.09% | 0.24% | 0.29% | -0.06% | 0.34% | 0.34% | 0.07% | |
| NZD | -0.24% | -0.12% | -0.03% | -0.34% | 0.01% | -0.34% | -0.27% | |
| CHF | 0.07% | 0.20% | 0.25% | -0.12% | 0.28% | -0.07% | 0.27% |
The heat map shows percentage changes of major currencies against each other. The base currency is picked from the left column, while the quote currency is picked from the top row. For example, if you pick the Swiss Franc from the left column and move along the horizontal line to the US Dollar, the percentage change displayed in the box will represent CHF (base)/USD (quote).

ผู้ใช้กว่าหนึ่งล้านคนพึ่งพา FXStreet สำหรับข้อมูลตลาดเรียลไทม์ เครื่องมือกราฟ การวิเคราะห์จากผู้เชี่ยวชาญ และข่าวฟอเร็กซ์ ปฏิทินเศรษฐกิจที่ครอบคลุมและเว็บบินาร์การศึกษาช่วยให้เทรดเดอร์ทันเหตุการณ์และตัดสินใจอย่างรอบคอบ FXStreet มีทีมงานประมาณ 60 คน แบ่งระหว่างสำนักงานใหญ่บาร์เซโลนาและภูมิภาคต่าง ๆ ทั่วโลก
อ่านเพิ่มเติม


