
USD/JPY Price Forecast: Reclaims 158.00 as bulls target intervention area
โดย Christian Borjon Valencia
อัปเดตแล้ว: 14 May 2026


บทความยอดนิยม

USD/JPY rallies past the 158.00 figure and also above the 20-day Simple Moving Average of 158.23, up by over 0.32% on Thursday as buyers target the 50-day SMA at 158.75 as the next key resistance.
- USD/JPY clears 20-day SMA, confirming buyers are gaining traction.
- RSI breaks above 50, signaling renewed bullish momentum strength.
- Move past 158.75 exposes 159.00 and intervention risk zone.
USD/JPY rallies past the 158.00 figure and also above the 20-day Simple Moving Average of 158.23, up by over 0.32% on Thursday as buyers target the 50-day SMA at 158.75 as the next key resistance.
USD/JPY Price Forecast: Technical outlook
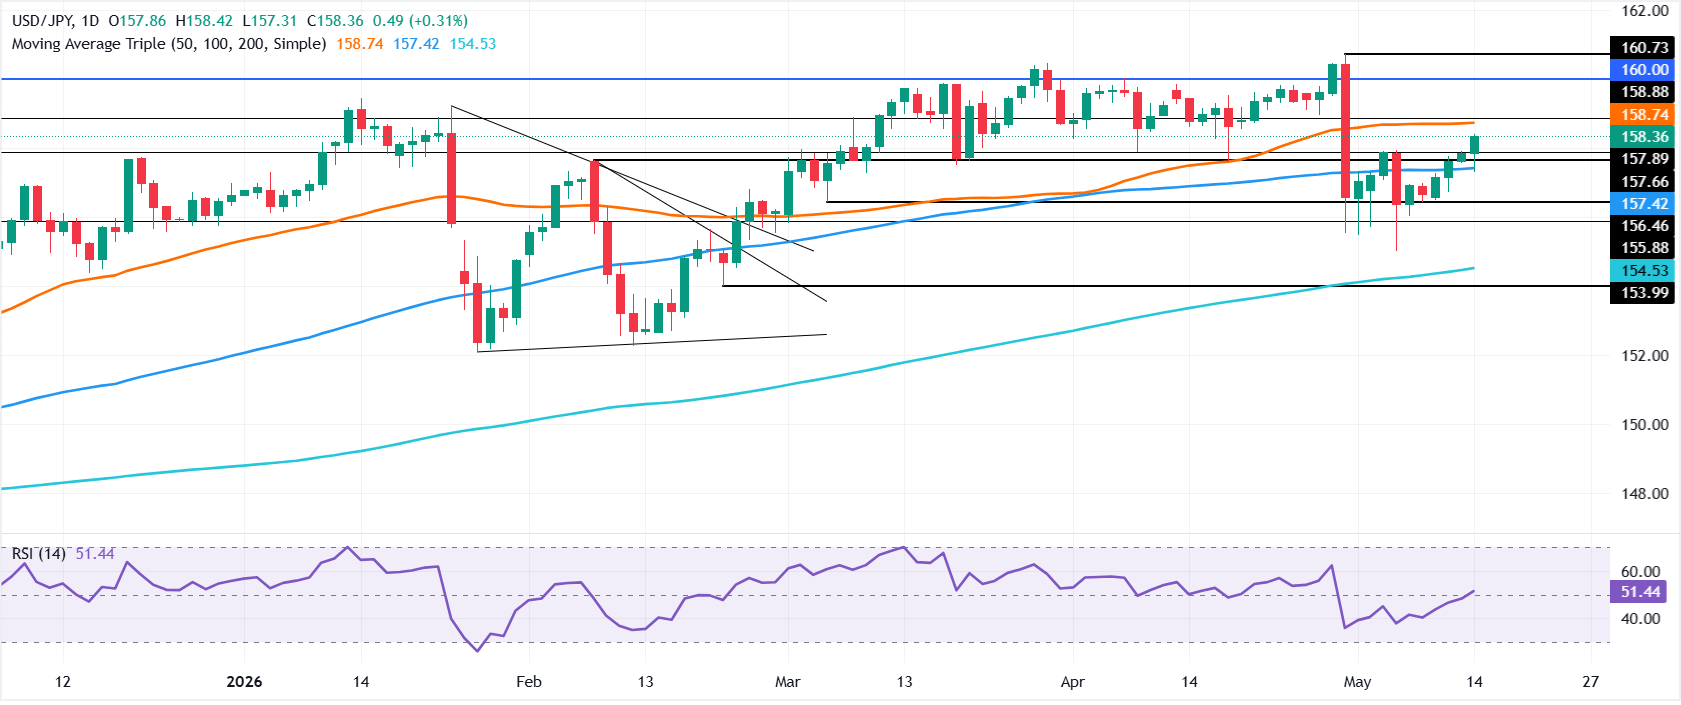
Price action shows that buyers are moving in, as USD/JPY printed a higher high over the last four trading days, clearing the path to reclaim 158.00. Momentum is bullish, as seen in the Relative Strength Index (RSI), which has cleared the 50-neutral level, an indication that buyers are gaining steam.
On the upside, the next resistance is the 50-day SMA, which lies ahead of the 159.00 figure. Traders should be aware that the pair is near the Japanese authorities' intervention zone, so a move within the 159.00-160.00 area would open the door for renewed action by the Bank of Japan (BoJ).
Downwards, if USD/JPY drops below 158.00, this clears the path to challenge the 100-day SMA at 157.43. On further weakness, the 157.00 milestone emerges as the next key support, followed by the May 6 cycle low of 155.03.
USD/JPY Price Chart – Daily
Japanese Yen Price This week
The table below shows the percentage change of Japanese Yen (JPY) against listed major currencies this week. Japanese Yen was the strongest against the British Pound.
| USD | EUR | GBP | JPY | CAD | AUD | NZD | CHF | |
|---|---|---|---|---|---|---|---|---|
| USD | 0.67% | 1.16% | 1.09% | 0.26% | 0.01% | 0.43% | 0.74% | |
| EUR | -0.67% | 0.48% | 0.48% | -0.42% | -0.66% | -0.28% | 0.07% | |
| GBP | -1.16% | -0.48% | -0.51% | -0.92% | -1.16% | -0.75% | -0.40% | |
| JPY | -1.09% | -0.48% | 0.51% | -0.88% | -1.09% | -0.67% | -0.31% | |
| CAD | -0.26% | 0.42% | 0.92% | 0.88% | -0.17% | 0.22% | 0.48% | |
| AUD | -0.01% | 0.66% | 1.16% | 1.09% | 0.17% | 0.42% | 0.74% | |
| NZD | -0.43% | 0.28% | 0.75% | 0.67% | -0.22% | -0.42% | 0.32% | |
| CHF | -0.74% | -0.07% | 0.40% | 0.31% | -0.48% | -0.74% | -0.32% |
The heat map shows percentage changes of major currencies against each other. The base currency is picked from the left column, while the quote currency is picked from the top row. For example, if you pick the Japanese Yen from the left column and move along the horizontal line to the US Dollar, the percentage change displayed in the box will represent JPY (base)/USD (quote).

ผู้ใช้กว่าหนึ่งล้านคนพึ่งพา FXStreet สำหรับข้อมูลตลาดเรียลไทม์ เครื่องมือกราฟ การวิเคราะห์จากผู้เชี่ยวชาญ และข่าวฟอเร็กซ์ ปฏิทินเศรษฐกิจที่ครอบคลุมและเว็บบินาร์การศึกษาช่วยให้เทรดเดอร์ทันเหตุการณ์และตัดสินใจอย่างรอบคอบ FXStreet มีทีมงานประมาณ 60 คน แบ่งระหว่างสำนักงานใหญ่บาร์เซโลนาและภูมิภาคต่าง ๆ ทั่วโลก
อ่านเพิ่มเติม


