
USD/JPY Price Forecast: Scope for further upside towards 160.50 improves amid triangle breakout
โดย Sagar Dua
อัปเดตแล้ว: 23 Apr 2026


บทความยอดนิยม

The USD/JPY pair extends its two-day upside to near 159.75 during the European trading session on Thursday. The pair reflects strength as the US Dollar (USD) outperforms its peers due to rising oil prices amid the prolonged closure of the Strait of Hormuz.
- USD/JPY recovers further to near 159.75 as the US Dollar outperforms its peers.
- The US Dollar gains as higher oil prices boost the US inflation projections.
- Investors await the flash US S&P Global PMI and the BoJ policy announcement.
The USD/JPY pair extends its two-day upside to near 159.75 during the European trading session on Thursday. The pair reflects strength as the US Dollar (USD) outperforms its peers due to rising oil prices amid the prolonged closure of the Strait of Hormuz.
US Dollar Price Today
The table below shows the percentage change of US Dollar (USD) against listed major currencies today. US Dollar was the strongest against the New Zealand Dollar.
| USD | EUR | GBP | JPY | CAD | AUD | NZD | CHF | |
|---|---|---|---|---|---|---|---|---|
| USD | 0.20% | 0.10% | 0.16% | 0.03% | 0.32% | 0.48% | 0.11% | |
| EUR | -0.20% | -0.08% | -0.06% | -0.17% | 0.11% | 0.28% | -0.11% | |
| GBP | -0.10% | 0.08% | 0.04% | -0.09% | 0.21% | 0.37% | -0.03% | |
| JPY | -0.16% | 0.06% | -0.04% | -0.14% | 0.17% | 0.29% | -0.06% | |
| CAD | -0.03% | 0.17% | 0.09% | 0.14% | 0.31% | 0.45% | 0.06% | |
| AUD | -0.32% | -0.11% | -0.21% | -0.17% | -0.31% | 0.16% | -0.27% | |
| NZD | -0.48% | -0.28% | -0.37% | -0.29% | -0.45% | -0.16% | -0.40% | |
| CHF | -0.11% | 0.11% | 0.03% | 0.06% | -0.06% | 0.27% | 0.40% |
The heat map shows percentage changes of major currencies against each other. The base currency is picked from the left column, while the quote currency is picked from the top row. For example, if you pick the US Dollar from the left column and move along the horizontal line to the Japanese Yen, the percentage change displayed in the box will represent USD (base)/JPY (quote).
As of writing, the US Dollar Index (DXY), which tracks the Greenback’s value against six major currencies, trades 0.2% higher to near 98.80, the highest level seen in over a week.
Higher oil prices have boosted United States (US) inflation expectations, a scenario that discourages the Federal Reserve (Fed) from easing its monetary policy. According to the CME FedWatch tool, the odds of the Fed holding interest rates steady in the current range of 3.50%-3.75% in the December meeting are 76.8%.
In Thursday’s session, investors will focus on the preliminary US S&P Global Purchasing Managers’ Index (PMI) data for April, which will be published at 13:45 GMT. The US private sector business activity growth is expected to have increased due to improvement in both the manufacturing and the services sector output.
Meanwhile, the Japanese Yen (JPY) trades mixed against its major currency peers, as investors shift focus to the Bank of Japan’s (BoJ) monetary policy announcement on April 28, Tuesday.
USD/JPY technical analysis
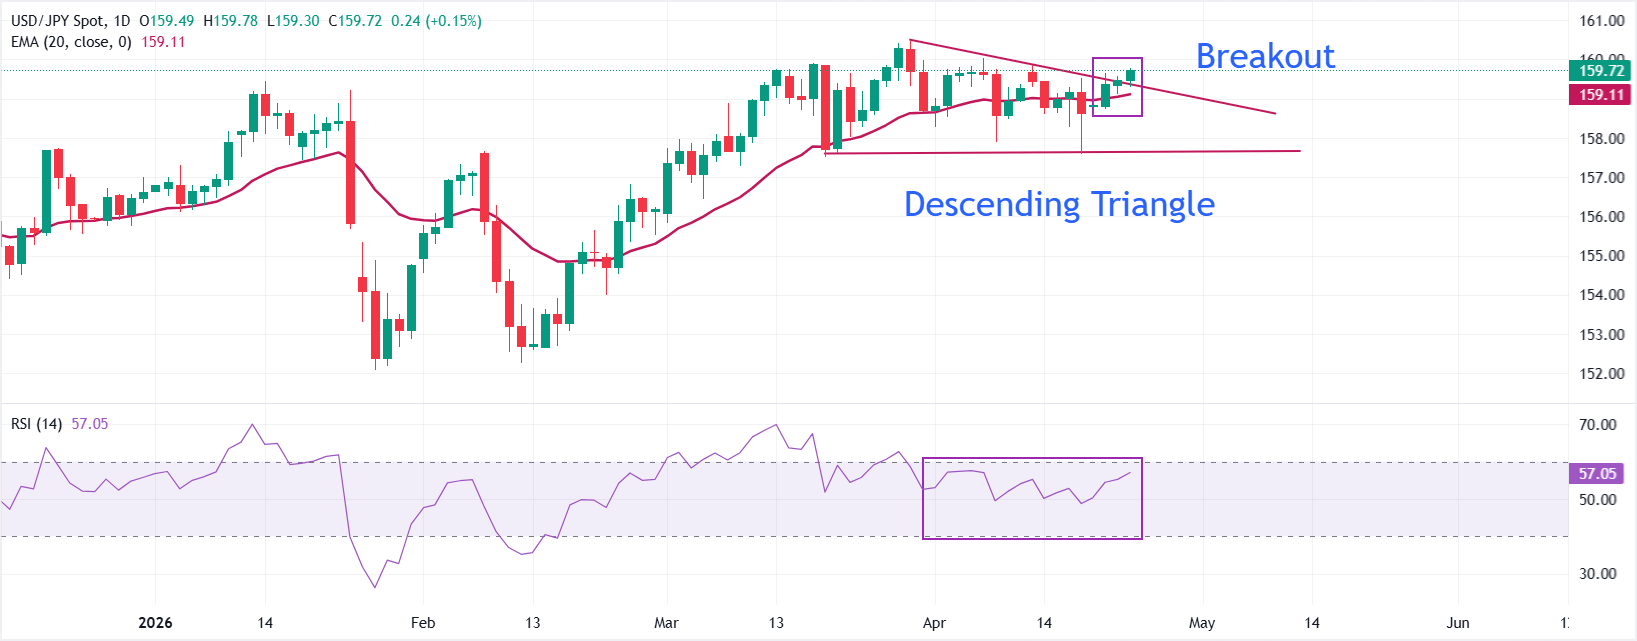
USD/JPY trades higher at around 159.75 at the press time. The pair holds a bullish near-term bias amid the sustainability of a Descending Triangle breakout/ Also, rising 20-day Exponential Moving Average (EMA) at 159.11 bollters the near-tem bullish tone. This positioning suggests dips are still being bought, while the Relative Strength Index (RSI) near 57 stays in positive but not overbought territory, hinting that upside momentum is constructive yet controlled.
Looking up, the pair could extend its upside towards an over 21-month high at 160.46; a sustained move above that level would widen the scope for further upside towards 161.00. On the downside, immediate support is seen at the former resistance trend line around 159.41, followed by the 20-day EMA at 159.11. A deeper pullback could challenge the horizontal support of the triangle formation near 157.64.
(The technical analysis of this story was written with the help of an AI tool.)
US Dollar FAQs
The US Dollar (USD) is the official currency of the United States of America, and the ‘de facto’ currency of a significant number of other countries where it is found in circulation alongside local notes. It is the most heavily traded currency in the world, accounting for over 88% of all global foreign exchange turnover, or an average of $6.6 trillion in transactions per day, according to data from 2022. Following the second world war, the USD took over from the British Pound as the world’s reserve currency. For most of its history, the US Dollar was backed by Gold, until the Bretton Woods Agreement in 1971 when the Gold Standard went away.
The most important single factor impacting on the value of the US Dollar is monetary policy, which is shaped by the Federal Reserve (Fed). The Fed has two mandates: to achieve price stability (control inflation) and foster full employment. Its primary tool to achieve these two goals is by adjusting interest rates. When prices are rising too quickly and inflation is above the Fed’s 2% target, the Fed will raise rates, which helps the USD value. When inflation falls below 2% or the Unemployment Rate is too high, the Fed may lower interest rates, which weighs on the Greenback.
In extreme situations, the Federal Reserve can also print more Dollars and enact quantitative easing (QE). QE is the process by which the Fed substantially increases the flow of credit in a stuck financial system. It is a non-standard policy measure used when credit has dried up because banks will not lend to each other (out of the fear of counterparty default). It is a last resort when simply lowering interest rates is unlikely to achieve the necessary result. It was the Fed’s weapon of choice to combat the credit crunch that occurred during the Great Financial Crisis in 2008. It involves the Fed printing more Dollars and using them to buy US government bonds predominantly from financial institutions. QE usually leads to a weaker US Dollar.
Quantitative tightening (QT) is the reverse process whereby the Federal Reserve stops buying bonds from financial institutions and does not reinvest the principal from the bonds it holds maturing in new purchases. It is usually positive for the US Dollar.

ผู้ใช้กว่าหนึ่งล้านคนพึ่งพา FXStreet สำหรับข้อมูลตลาดเรียลไทม์ เครื่องมือกราฟ การวิเคราะห์จากผู้เชี่ยวชาญ และข่าวฟอเร็กซ์ ปฏิทินเศรษฐกิจที่ครอบคลุมและเว็บบินาร์การศึกษาช่วยให้เทรดเดอร์ทันเหตุการณ์และตัดสินใจอย่างรอบคอบ FXStreet มีทีมงานประมาณ 60 คน แบ่งระหว่างสำนักงานใหญ่บาร์เซโลนาและภูมิภาคต่าง ๆ ทั่วโลก
อ่านเพิ่มเติม


