

Dow Jones Industrial Average rallies on a bid nobody made
- DJIA trades near 53,600, up 0.44%, on a Treasury move to double long-dated debt buybacks.
- Thirty-year yield down nine basis points from a 19-year high above 5.33%.
- The larger operations do not begin until September 9 and expire November 4.
The Dow Jones Industrial Average trades near 53,600 on Wednesday, more than 230 points and 0.44% higher, and none of that gain is about earnings, growth or the Federal Reserve. The Treasury Department announced early in the day that it will at least double the maximum size of its liquidity-support buyback operations in longer-dated coupons, lifting the ceiling from 2 billion Dollars per operation to at least 4 billion. Long-end yields fell hard, and equities followed them up.

The bid that has not been made
The calendar attached to that announcement is doing none of the work the tape credited it with. Those larger operations do not begin until September 9, run only through November 4, and are revisited at the quarterly refunding on that same date. Not one additional bond has been bought.
The thirty-year bond yield, which printed above 5.33% on Tuesday and was its highest since June 2007, gave up more than nine basis points to near 5.19%, and the ten-year note shed more than six bps to near 4.65%. A maximum operation size rising by 2 billion Dollars moved the long end that far three weeks before the first larger operation runs. That is a measure of how thin the bid has become in a sector that has run a buyers' strike since late June, not a measure of demand returning to it.
A rearrangement, not a paydown
What the Treasury announced is not debt reduction. Repurchasing long-dated coupon paper while refunding the difference at the front of the curve rearranges the maturity schedule rather than shrinking it, and the issuer ends up shortening the average maturity of its own borrowing. The reason it would choose to do that is the price the long end is charging.
The fiscal arithmetic makes the motive legible. July's federal deficit ran 432.3 billion Dollars, the largest monthly shortfall since March 2021, inside a fiscal-year total near 1.8 trillion Dollars, with interest expense already past 1.1 trillion Dollars. Foreign holdings of Treasuries fell in June as the United Kingdom, China and Japan each trimmed. A borrower in that position does not double a facility to be helpful.
Accommodation nobody voted on
The Federal Open Market Committee (FOMC) publishes the minutes of its July meeting at 18:00 GMT, and the dissent is the reason to read them. Three regional Fed presidents voted for a quarter-point increase against the hold, the first three-way dissent in a single direction since September 2016, and nothing published so far explains what separates them from the nine who held.
Set that against what the fiscal authority did at midday. The hawks on the committee want the policy rate higher against consumer prices running 3.4% in July, while the borrower has just leaned on the long end in the opposite direction. Duration support supplied by the issuer is accommodation arriving by another door, and no member of the committee voted for it.
Where the points actually came from
The session's largest single-name move delivered the index nothing at all. Moderna (MRNA) more than doubled, up over 120% and on track for its best day on record, after a skin cancer vaccine developed with Merck (MRK) cleared a late-stage trial. Moderna sits outside the thirty. Merck sits inside it, and a 10% advance in the partner that is a member is where the Dow found real support.
Rate-sensitive components did the rest, with Home Depot (HD) and McDonald's (MCD) each adding around 1% in a structure that converts Dollars of share price directly into index points. Declines of roughly 4% at Broadcom (AVGO) and Advanced Micro Devices (AMD) on a disappointing set of quarterly numbers out of the artificial intelligence complex cost the Dow nothing, because neither is a member. The spread between the averages again comes down to who is in the index rather than to what the economy is doing.
The rest of the week
Initial jobless claims are forecast at 210K on Thursday at 12:30 GMT against 209K, alongside a Philadelphia Fed manufacturing survey expected at 25 after 41.4, which would be a severe give-back inside a single month. A regional Fed president speaks at 15:10 GMT. Friday brings the preliminary August S&P Global Purchasing Managers Index (PMI) surveys at 13:45 GMT, manufacturing expected at 53.8 from 53.9 and services at 54 from 54.6, against a composite prior of 54.5.
Levels
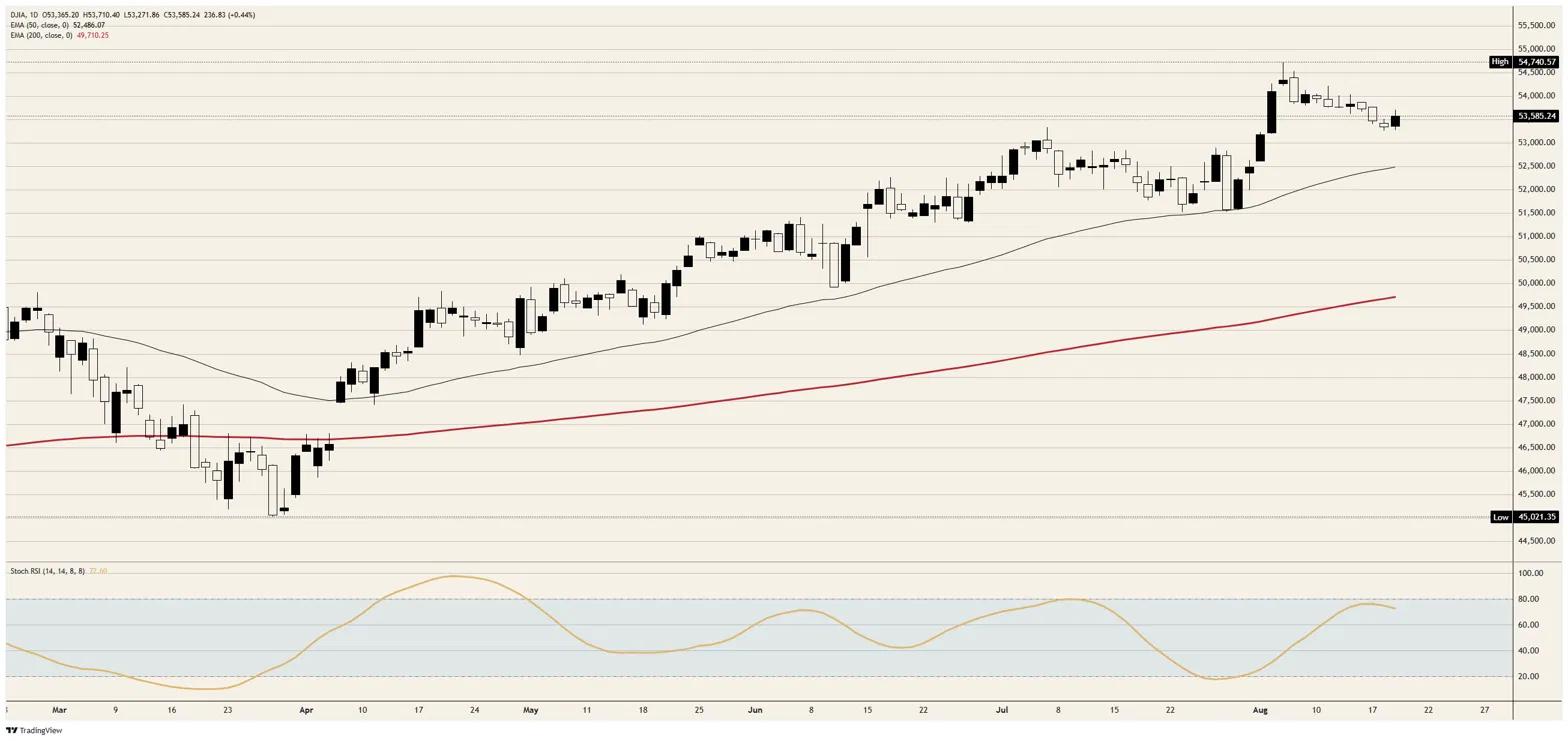
Resistance: Just above 53,700 caps the session so far, and the 53,800 area above it has turned back every attempt since the middle of the month. Beyond that, 54,100 marks the early-August ledge, with the record just short of 54,750.
Support: The 53,250 area held the session low, with the 53,200 area immediately beneath it and the 53,000 handle after that. The 50-day Exponential Moving Average (EMA) near 52,500 is the first structural floor and is rising, with the 200-day near 49,700 far below.
Bias: Bearish while the 53,800 area caps. The daily Stochastic Relative Strength Index (Stoch RSI) at 72.60 has climbed into the upper band without the index making a new high, and a rally bought with an announcement rather than with a bid is the weakest kind on offer. Objectives are the 53,200 area then the 53,000 handle. Invalidation is a daily close above 53,900.
Dow Jones daily chart
Dow Jones FAQs
The Dow Jones Industrial Average, one of the oldest stock market indices in the world, is compiled of the 30 most traded stocks in the US. The index is price-weighted rather than weighted by capitalization. It is calculated by summing the prices of the constituent stocks and dividing them by a factor, currently 0.152. The index was founded by Charles Dow, who also founded the Wall Street Journal. In later years it has been criticized for not being broadly representative enough because it only tracks 30 conglomerates, unlike broader indices such as the S&P 500.
Many different factors drive the Dow Jones Industrial Average (DJIA). The aggregate performance of the component companies revealed in quarterly company earnings reports is the main one. US and global macroeconomic data also contributes as it impacts on investor sentiment. The level of interest rates, set by the Federal Reserve (Fed), also influences the DJIA as it affects the cost of credit, on which many corporations are heavily reliant. Therefore, inflation can be a major driver as well as other metrics which impact the Fed decisions.
Dow Theory is a method for identifying the primary trend of the stock market developed by Charles Dow. A key step is to compare the direction of the Dow Jones Industrial Average (DJIA) and the Dow Jones Transportation Average (DJTA) and only follow trends where both are moving in the same direction. Volume is a confirmatory criteria. The theory uses elements of peak and trough analysis. Dow’s theory posits three trend phases: accumulation, when smart money starts buying or selling; public participation, when the wider public joins in; and distribution, when the smart money exits.
There are a number of ways to trade the DJIA. One is to use ETFs which allow investors to trade the DJIA as a single security, rather than having to buy shares in all 30 constituent companies. A leading example is the SPDR Dow Jones Industrial Average ETF (DIA). DJIA futures contracts enable traders to speculate on the future value of the index and Options provide the right, but not the obligation, to buy or sell the index at a predetermined price in the future. Mutual funds enable investors to buy a share of a diversified portfolio of DJIA stocks thus providing exposure to the overall index.













