

Silver Price Forecast: XAG/USD tests the $55 floor as sellers retain control
- Silver extends its decline as the US Dollar rebounds and Treasury yields stabilize.
- Higher Oil prices keep inflation risks and expectations of a Fed rate hike later this year alive.
- XAG/USD trades near the $55 floor, with the technical outlook tilted firmly to the downside.
Silver (XAG/USD) extends its decline on Thursday as the US Dollar (USD) rebounds and US Treasury yields stabilize following a two-day drop driven by softer-than-expected US inflation data. At the time of writing, XAG/USD trades around $55.75, down 3.50% on the day.

Despite the softer inflation readings, price pressures could pick up again as escalating tensions in the Middle East drive Oil prices higher. This keeps the possibility of a Federal Reserve (Fed) interest rate hike later this year alive, supporting the US Dollar and weighing on the non-yielding metal, which typically performs better in a low-interest-rate environment.
XAG/USD remains in a corrective phase. The latest leg lower has brought prices back to the December 2025 lows, a level that was also tested in June.
The metal is now trading more than 50% below its record high of $121 reached in January and remains vulnerable to further losses unless Fed rate hike expectations fade, which appears unlikely in the near term.
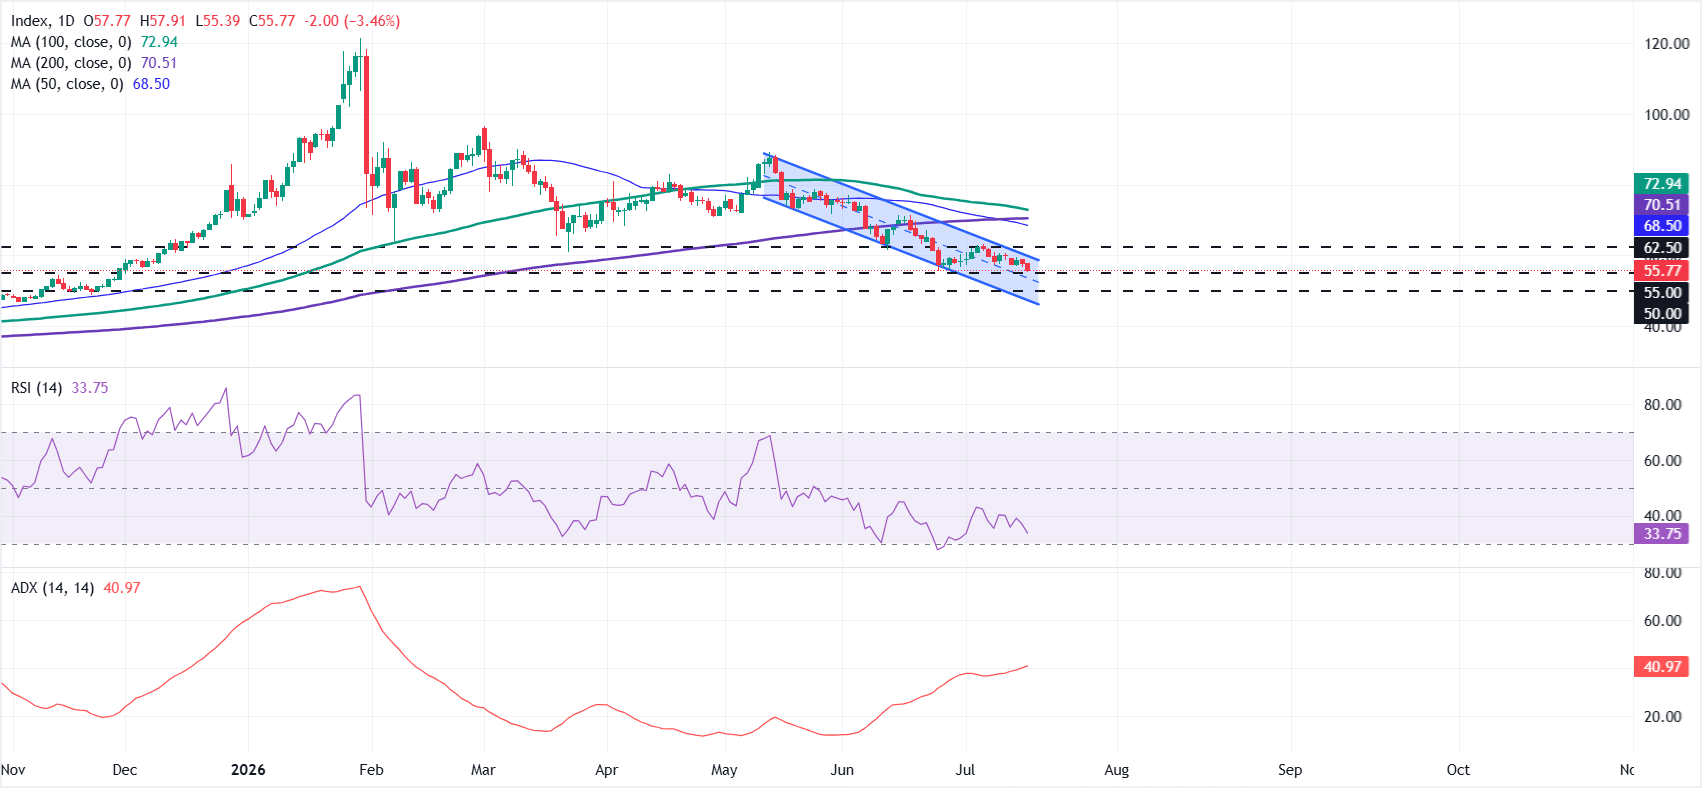
From a technical perspective, XAG/USD extends its decline within a well-defined descending parallel channel and trades below the 50-day, 100-day and 200-day Simple Moving Averages (SMAs), reinforcing the bearish outlook.
The Relative Strength Index (RSI) on the daily chart is near 34 and the Average Directional Index around 41, suggesting a strong but still downside-skewed trend as price consolidates only slightly above the $55 structural floor.
On the upside, initial resistance emerges at the upper boundary of the descending channel near $60, followed by the horizontal barrier at $62.50 before the clustered 50- and 200-day SMAs around $68.50-70.51, and the more distant 100-day SMA at $72.94.
On the downside, immediate support lies at $55.00, followed by the psychological $50 mark and the lower boundary of the channel near $45.50. These levels could slow the decline, but sellers retain control while XAG/USD trades below its major moving averages.














