

USD/CHF Price Forecast: Reclaims 0.81 as market structure targets 0.82
- USD/CHF extends higher as buyers reclaim 0.8100 resistance.
- RSI confirms bullish momentum, supporting higher-high continuation structure.
- Break above 0.8149 exposes 0.8172 and 0.8200 resistance.
USD/CHF registers solid gains on Wednesday, with buyers reclaiming the 0.8100 figure amid a trading session in which the Greenback loses ground against most G8 FX currencies but posts gains versus the haven status of the Swiss Franc. The pair trades at 0.8146, up more than 0.20%.
USD/CHF Price Forecast: Technical outlook
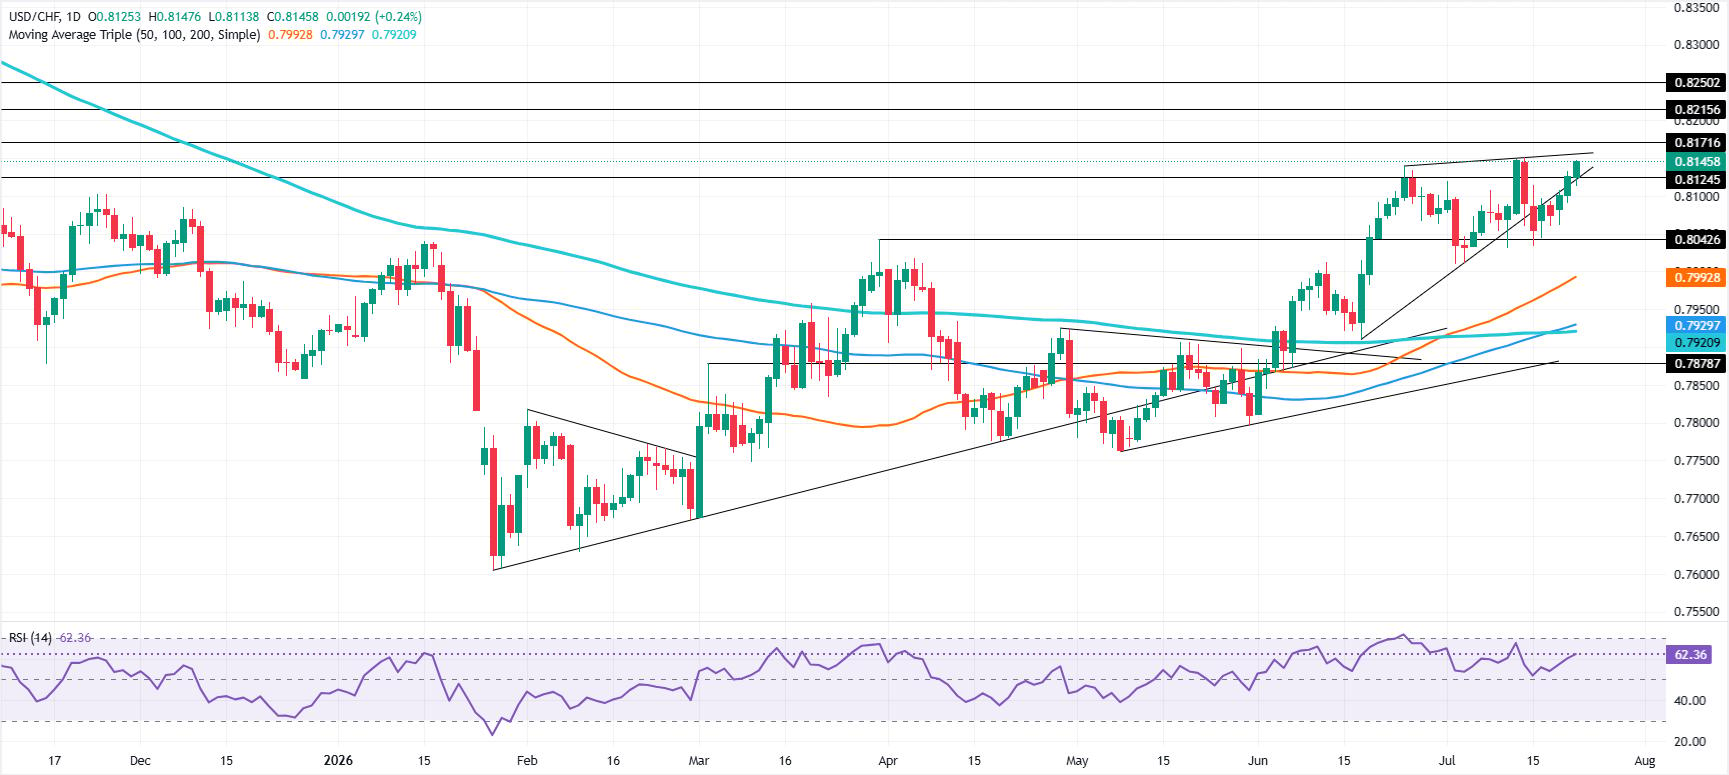
The market structure remains bullish, with USD/CHF forming a series of higher highs and higher lows. Also, the Relative Strength Index (RSI) is bullish, indicating that buyers are gaining momentum and opening the door to further upside. Hence, the path of least resistance is upwards.
The first ceiling level for USD/CHF to clear is the July 13 high at 0.8149. Once surpassed, the next stop would be the August 1, 2025, high at 0.8172, followed by 0.8200. On further strength, the next area of interest will be the June 19, 2025, peak at 0.8215, ahead of the June 4, 2025, daily peak at 0.8250. Once those levels are taken out, the next stop is 0.8300.
On the flip side, to turn bearish, the USD/CHF needs to clear the latest cycle low seen at 0.8061, the July 17 low of the day (LOD), followed by the July 10 swing low of 0.8030. Below lies the 0.8000 mark.
USD/CHF Price Chart – Daily
Swiss Franc Price This week
The table below shows the percentage change of Swiss Franc (CHF) against listed major currencies this week. Swiss Franc was the strongest against the British Pound.
| USD | EUR | GBP | JPY | CAD | AUD | NZD | CHF | |
|---|---|---|---|---|---|---|---|---|
| USD | 0.14% | 0.59% | 0.49% | 0.50% | -0.42% | 0.30% | 0.75% | |
| EUR | -0.14% | 0.46% | 0.28% | 0.37% | -0.55% | 0.15% | 0.60% | |
| GBP | -0.59% | -0.46% | -0.17% | -0.11% | -1.00% | -0.30% | 0.19% | |
| JPY | -0.49% | -0.28% | 0.17% | 0.10% | -0.85% | -0.21% | 0.36% | |
| CAD | -0.50% | -0.37% | 0.11% | -0.10% | -0.87% | -0.32% | 0.29% | |
| AUD | 0.42% | 0.55% | 1.00% | 0.85% | 0.87% | 0.71% | 1.20% | |
| NZD | -0.30% | -0.15% | 0.30% | 0.21% | 0.32% | -0.71% | 0.49% | |
| CHF | -0.75% | -0.60% | -0.19% | -0.36% | -0.29% | -1.20% | -0.49% |
The heat map shows percentage changes of major currencies against each other. The base currency is picked from the left column, while the quote currency is picked from the top row. For example, if you pick the Swiss Franc from the left column and move along the horizontal line to the US Dollar, the percentage change displayed in the box will represent CHF (base)/USD (quote).














