
AUD/USD Price Forecast: Remains below 0.7050, nine-day EMA as bullish bias stabilizes
作者 Akhtar Faruqui
发布日期: 4 Mar 2026 | 修改日期: 4 Mar 2026


热门文章

AUD/USD pares its daily losses but remains in the negative territory for the second successive day, trading around 0.7030 during the early European hours on Wednesday.
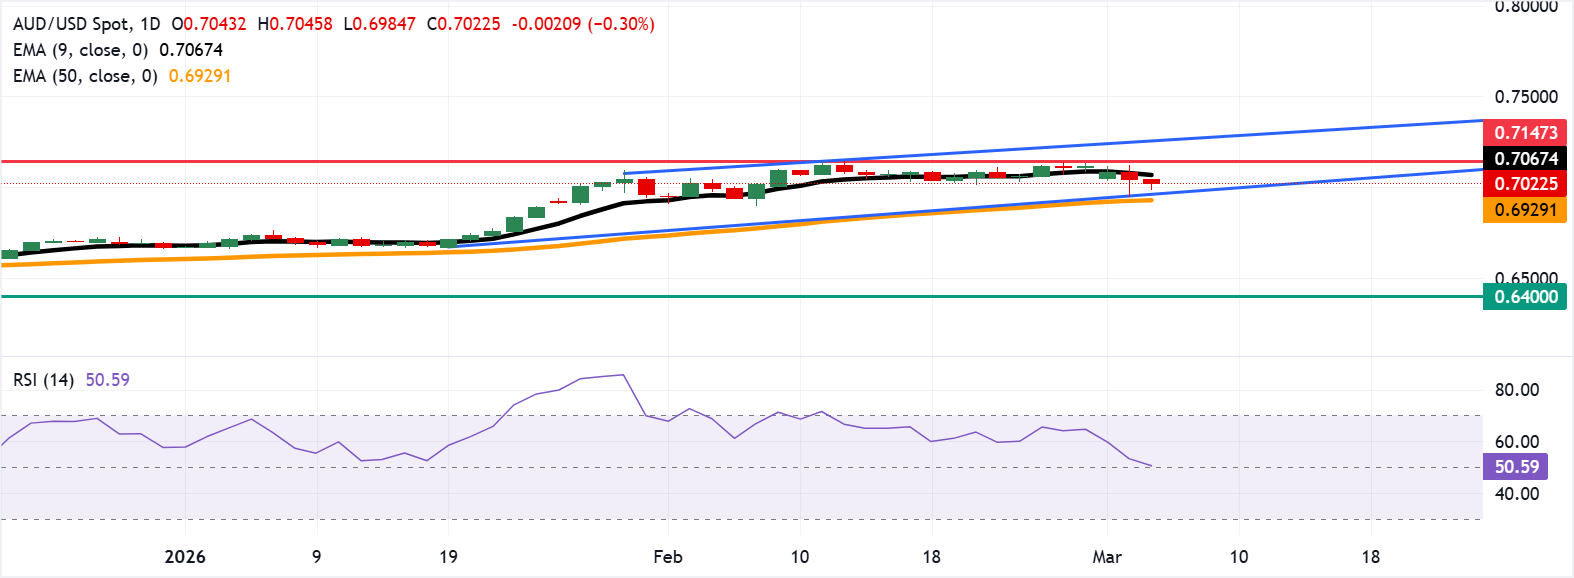
- AUD/USD may rebound toward the nine-day EMA of 0.7067.
- The 14-day Relative Strength Index has eased to around 53, suggesting upside momentum has normalized.
- The primary support is seen at the lower ascending channel boundary around 0.6950.
AUD/USD pares its daily losses but remains in the negative territory for the second successive day, trading around 0.7030 during the early European hours on Wednesday. Daily chart analysis indicates that the pair is remaining within the ascending channel pattern, indicating a persistent bullish bias.
The near-term bias stays mildly bearish as the AUD/USD pair holds below the nine-day Exponential Moving Average (EMA) and remains comfortably above the 50-day EMA at 0.6930, preserving the broader uptrend.
The 14-day Relative Strength Index (RSI) has eased to around 53 from previously overbought readings, indicating that upside momentum has normalised rather than reversed, with buyers still defending the short-term trend structure.
Immediate resistance is seen at the nine-day EMA of 0.7067, followed by the three-year high of 0.7147, reached on February 12. Further advances would support the AUD/USD pair to test the upper boundary of the ascending channel around 0.7260.
On the downside, the initial support lies at the lower ascending channel boundary around 0.6950, followed by the 50-day EMA at 0.6929. A daily close below the medium-term average would neutralise the current bullish bias and open a deeper retracement toward the “Rebound Support” area around 0.6400.
(The technical analysis of this story was written with the help of an AI tool.)
Australian Dollar Price Today
The table below shows the percentage change of Australian Dollar (AUD) against listed major currencies today. Australian Dollar was the weakest against the New Zealand Dollar.
| USD | EUR | GBP | JPY | CAD | AUD | NZD | CHF | |
|---|---|---|---|---|---|---|---|---|
| USD | 0.13% | 0.12% | -0.14% | -0.06% | 0.26% | -0.21% | 0.05% | |
| EUR | -0.13% | -0.02% | -0.27% | -0.19% | 0.14% | -0.34% | -0.08% | |
| GBP | -0.12% | 0.02% | -0.25% | -0.17% | 0.15% | -0.32% | -0.07% | |
| JPY | 0.14% | 0.27% | 0.25% | 0.10% | 0.42% | -0.06% | 0.20% | |
| CAD | 0.06% | 0.19% | 0.17% | -0.10% | 0.32% | -0.15% | 0.10% | |
| AUD | -0.26% | -0.14% | -0.15% | -0.42% | -0.32% | -0.47% | -0.22% | |
| NZD | 0.21% | 0.34% | 0.32% | 0.06% | 0.15% | 0.47% | 0.25% | |
| CHF | -0.05% | 0.08% | 0.07% | -0.20% | -0.10% | 0.22% | -0.25% |
The heat map shows percentage changes of major currencies against each other. The base currency is picked from the left column, while the quote currency is picked from the top row. For example, if you pick the Australian Dollar from the left column and move along the horizontal line to the US Dollar, the percentage change displayed in the box will represent AUD (base)/USD (quote).

Acuity Trading 是一家成立于 2013 年、总部位于伦敦的金融科技公司,专注于 AI 驱动的另类数据和情绪分析,用于交易与投资。他们以可视化新闻和情绪工具革新在线交易体验,如今持续以最新的 AI 研究与技术提供可产生阿尔法的另类数据与高度互动的交易工具。
阅读更多


