
Trade The World
Cardano Price Forecast: ADA risks deeper correction as open interest drops to a yearly low, short bets surge
作者 Manish Chhetri
发布日期: 20 Oct 2025 | 修改日期: 20 Oct 2025


POPULAR ARTICLES

Cardano (ADA) hovers around $0.64 at the time of writing on Monday, having corrected nearly 7% in the previous week. Derivatives data signal waning trader confidence and growing expectations of further downside as Open Interest (OI) drops to a yearly low, coupled with a surge in short bets.
- Cardano price hovers around $0.64 on Monday after falling nearly 7% last week.
- Derivatives data show bearish signs as open interest dips to a year-to-date low while short bets hit a monthly high.
- The technical outlook indicates potential for a deeper correction, pushing ADA below the $0.60 level.
Cardano (ADA) hovers around $0.64 at the time of writing on Monday, having corrected nearly 7% in the previous week. Derivatives data signal waning trader confidence and growing expectations of further downside as Open Interest (OI) drops to a yearly low, coupled with a surge in short bets. The technical indicators also suggest the potential for a deeper correction targeting levels below $0.60.
Cardano’s derivatives hint at further correction
Cardano’s futures Open Interest (OI) dropped to $112.82 million on Monday, the lowest year-to-date level and levels not seen since November 2024, according to Coinglass data. This drop in OI reflects waning investor participation and projects a bearish outlook.
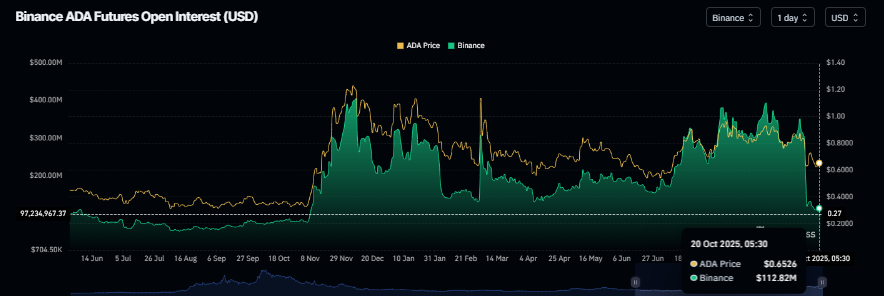
ADA futures OI chart. Source: Coinglass
CoinGlass’s ADA long-to-short ratio, which stands at 0.85, is the lowest value in a month. This ratio, below one, reflects bearish sentiment in the markets, as more traders are betting on the asset price to fall.
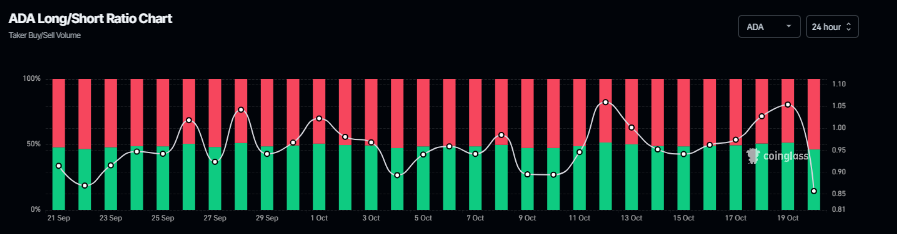
Cardano long-to-short ratio chart. Source: Coinglass
Cardano Price Forecast: ADA bears aiming for levels below $0.60
Cardano price faced rejection from the 61.8% Fibonacci retracement level at $0.73 on Tuesday and corrected more than 15% by Friday, closing below the $0.64 level. However, ADA recovered slightly during the weekend. At the time of writing on Monday, it hovers at around $0.65.
If ADA continues its correction, it could extend the decline toward the next key support level at $0.56.
The Relative Strength Index (RSI) on the daily chart reads 37, below the neutral level of 50, indicating that the bears are in control of the momentum. Moreover, the Moving Average Convergence Divergence (MACD) also showed a bearish crossover in early October, which remains in effect, further supporting the bearish view.
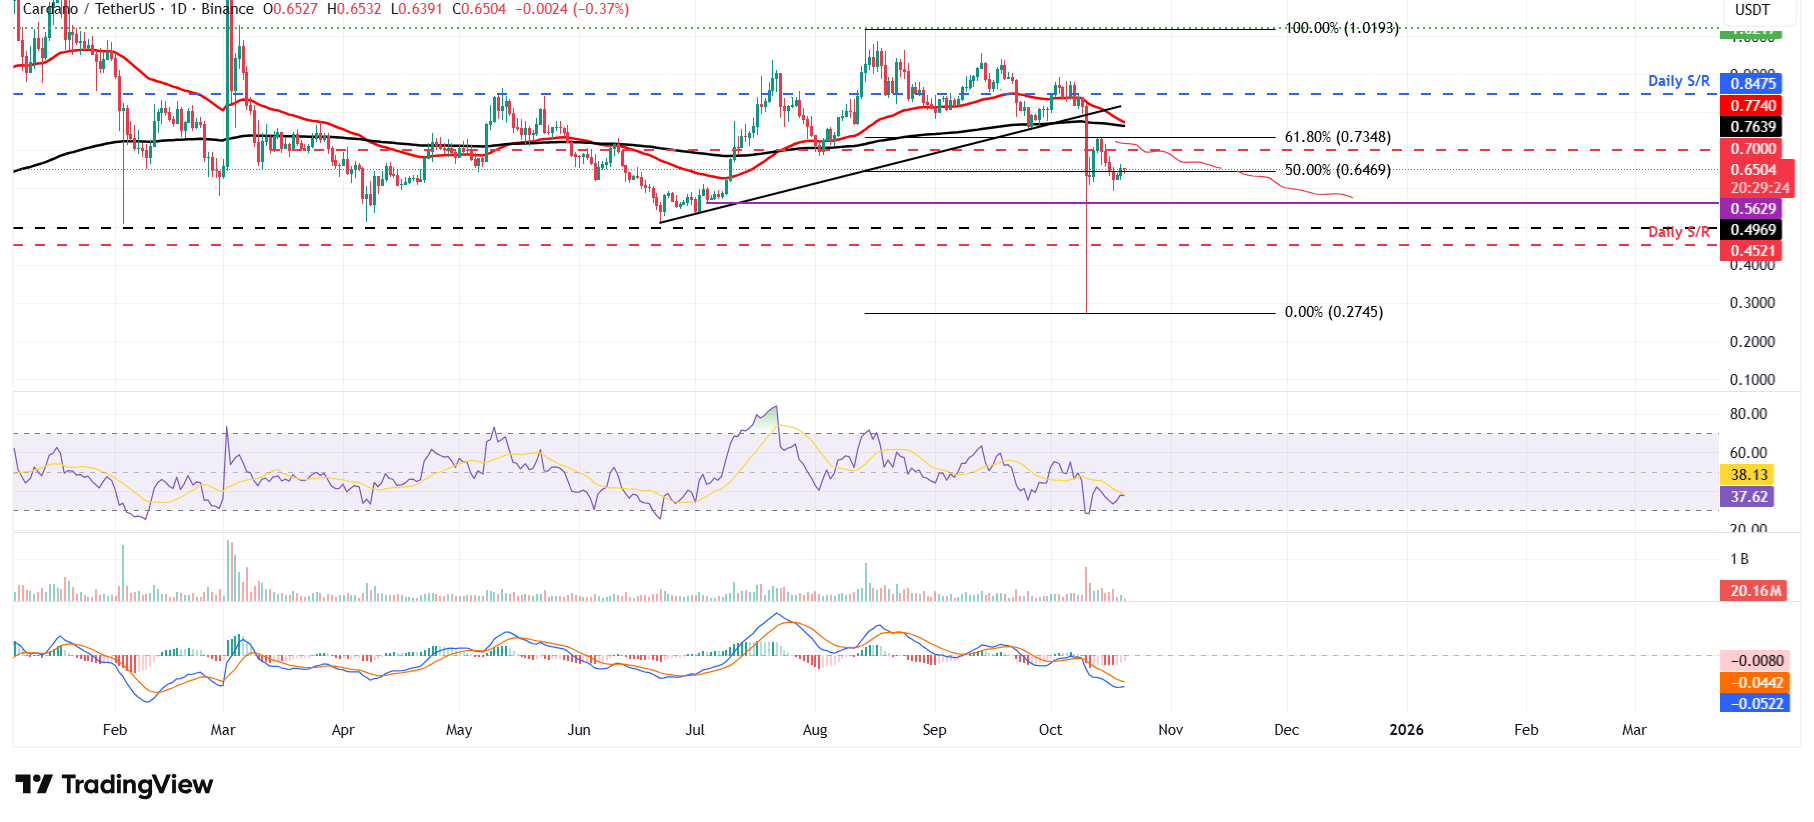
ADA/USDT daily chart
On the other hand, if ADA recovers, it could extend the recovery toward the 61.8% Fibonacci retracement level at $0.73.

Acuity Trading
Acuity Trading 是一家成立于 2013 年、总部位于伦敦的金融科技公司,专注于 AI 驱动的另类数据和情绪分析,用于交易与投资。他们以可视化新闻和情绪工具革新在线交易体验,如今持续以最新的 AI 研究与技术提供可产生阿尔法的另类数据与高度互动的交易工具。
Read More


