
Ethereum Price Forecast: FG Nexus continues distribution amid signs of returning risk-on sentiment
作者 Michael Ebiekutan
发布日期: 27 Feb 2026 | 修改日期: 27 Feb 2026


热门文章

FG Nexus, once dubbed an Ethereum treasury firm, resumed offloading the top altcoin on Wednesday, distributing 7,550 ETH, according to data from smart money tracker EmberCN.
Ethereum price today: $2,020
- FG Nexus sold another 7,550 ETH, pushing its total sales since last November to more than 21,000 ETH.
- Ethereum ETFs returned to inflows, pulling in $157 million on Wednesday.
- ETH is facing resistance near the $2,108 level and 20-day EMA.
FG Nexus, once dubbed an Ethereum treasury firm, resumed offloading the top altcoin on Wednesday, distributing 7,550 ETH, according to data from smart money tracker EmberCN.
The company earlier accumulated 50,770 ETH between August and September for an average price of $3,950, while indicating plans to sell other assets to fuel more ETH purchases.
However, the company walked back on its plan last November when it began selling portions of its treasury to diversify operations. Since then, it has sold more than 21,000 ETH at an average price of $2,649, realizing losses of about $86.9 million.
The move comes after ETH began crashing following the October 10 leverage flush, falling by over 50% over the past four months.
Despite FG Nexus' capitulation, top corporate Ethereum treasuries have held steady amid the downturn, with Thomas Lee-backed BitMine expanding its stash of the top altcoin weekly.
BitMine and SharpLink stand as the largest Ethereum treasuries with holdings of 4.42M ETH and 863K ETH, respectively.
Meanwhile, distribution has ceased across all retail cohorts over the past two weeks, with wallets holding 100-1K ETH and 1K-10K ETH seeing modest inflows.
On the institutional front, Ethereum exchange-traded funds (ETFs) recorded net inflows of $157 million on Wednesday, their largest since January 15, per SoSoValue data.
Ethereum Price Forecast: ETH tests $2,108 resistance amid signs of returning risk-on sentiment
Ethereum has seen $70.3 million in futures liquidations over the past 24 hours, led by $43.8 million in long liquidations.
In the daily chart, ETH trades at $2,032. The near-term bias is neutral with a mild bullish tilt after the pair rebounded from sub-$2,000 and started to distance itself from the recent lows. Price has crossed back above the 20-day Exponential Moving Average (EMA) near $2,060, indicating early recovery attempts after a prolonged decline. The Relative Strength Index (RSI) has lifted from oversold territory toward the low-40s, while the Stochastic retreats from overbought after a sharp upswing, together signaling fading downside momentum but not a fully established uptrend.
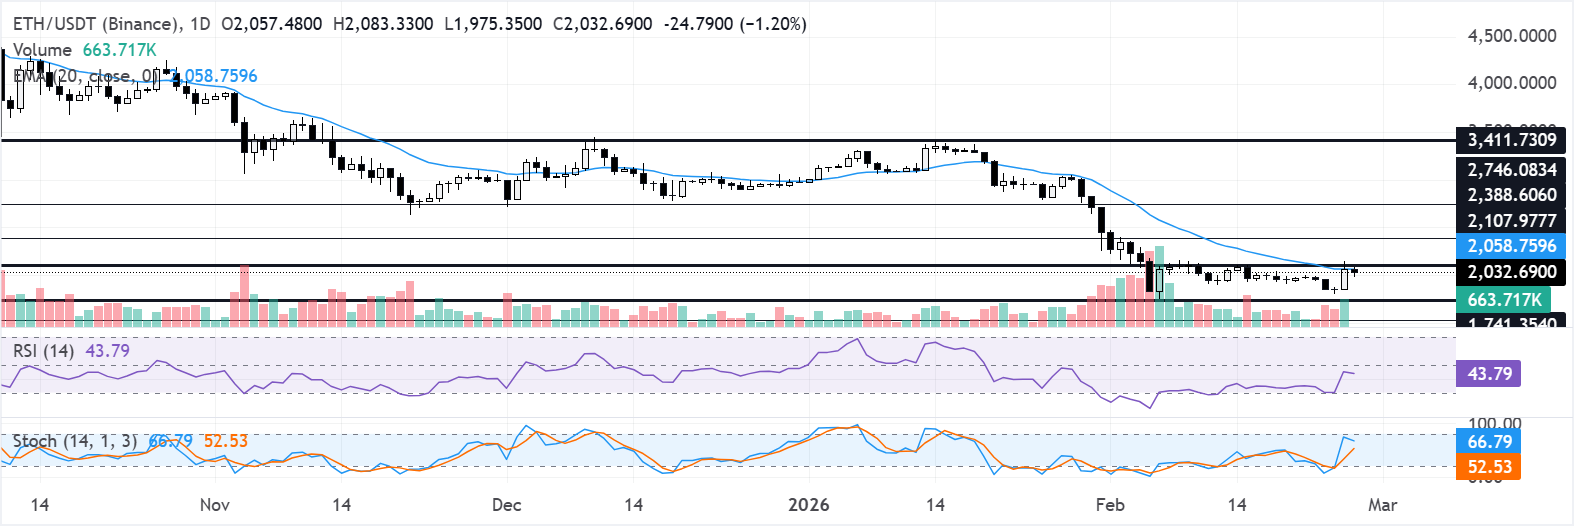
Immediate resistance stands at $2,108, which capped the latest bounce and aligns with the reclaimed 20-day EMA, followed by $2,389 and then $2,746 as the next upside barriers. A daily close above $2,108 would open the way for a broader recovery phase toward the mid-2,000s. On the downside, initial support is seen at the recent reaction area near $1,826 ahead of the horizontal level at $1,741, with a break below the latter exposing the deeper support band at $1,524 and then $1,405. Holding above $1,741 keeps the current stabilization pattern intact and preserves scope for further corrective gains.
(The technical analysis of this story was written with the help of an AI tool.)

Acuity Trading 是一家成立于 2013 年、总部位于伦敦的金融科技公司,专注于 AI 驱动的另类数据和情绪分析,用于交易与投资。他们以可视化新闻和情绪工具革新在线交易体验,如今持续以最新的 AI 研究与技术提供可产生阿尔法的另类数据与高度互动的交易工具。
阅读更多


