
Trade The World
NZD/USD Price Forecast: Bulls eye a break above 200-day SMA
作者 Christian Borjon Valencia
发布日期: 7 Oct 2025 | 修改日期: 7 Oct 2025


POPULAR ARTICLES

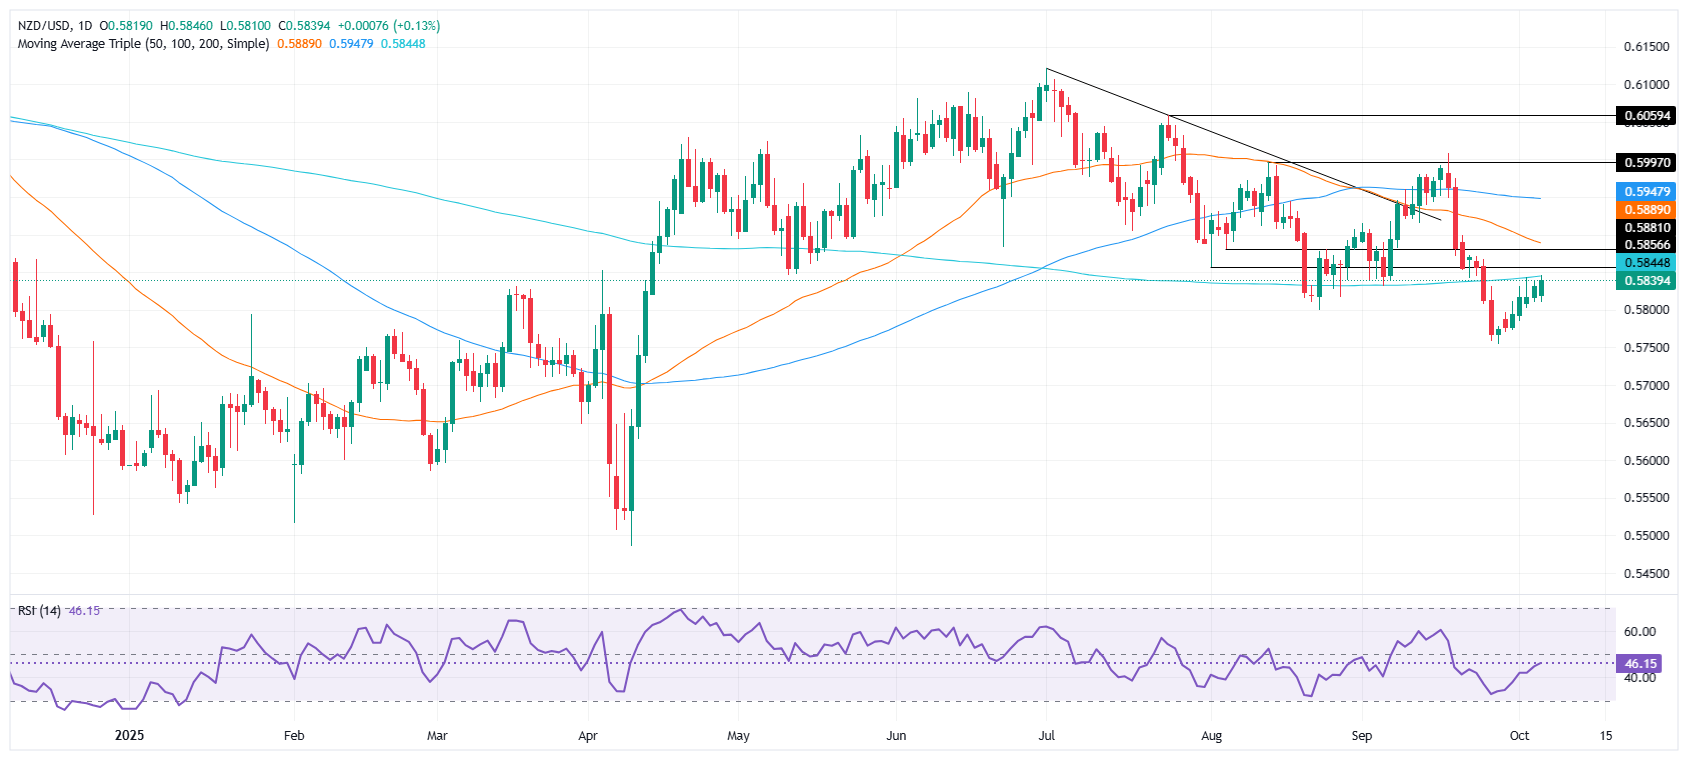
The New Zealand Dollar advances on Monday and trades near its daily close at around 0.5840 as Tuesday’s Asian session begins. Yesterday, the pair gained 0.20% but key resistance lies overhead with the 200-day Simple Moving Average (SMA) at 0.5848.
- Kiwi buyers target a close above the 200-day SMA at 0.5848 to trigger a bullish extension.
- Failure to reclaim the level may invite renewed selling pressure toward 0.5810 and the 0.5750 swing low.
- Momentum remains neutral-to-bearish, suggesting hesitation among buyers ahead of Tuesday’s trading session.
The New Zealand Dollar advances on Monday and trades near its daily close at around 0.5840 as Tuesday’s Asian session begins. Yesterday, the pair gained 0.20% but key resistance lies overhead with the 200-day Simple Moving Average (SMA) at 0.5848.
NZD/USD Price Forecast: Technical outlook
The technical picture shows the pair is neutral to downward biased, but a daily close above the 200-day SMA could open the door for further upside. If cleared, the next resistance would be the 20-day SMA at 0.5867 followed by the 50-day SMA at 0.5886 and the 100-day SMA at 0.5947.
Conversely, if NZD/USD stays below the 200-day SMA and bears drive prices lower, they would face key support at the October 6 low of 0.5810. A breach of the latter will expose the 0.5800 mark, followed by the September 26 swing low of 0.5754.
NZD/USD Price Chart – Daily
New Zealand Dollar FAQs
The New Zealand Dollar (NZD), also known as the Kiwi, is a well-known traded currency among investors. Its value is broadly determined by the health of the New Zealand economy and the country’s central bank policy. Still, there are some unique particularities that also can make NZD move. The performance of the Chinese economy tends to move the Kiwi because China is New Zealand’s biggest trading partner. Bad news for the Chinese economy likely means less New Zealand exports to the country, hitting the economy and thus its currency. Another factor moving NZD is dairy prices as the dairy industry is New Zealand’s main export. High dairy prices boost export income, contributing positively to the economy and thus to the NZD.
The Reserve Bank of New Zealand (RBNZ) aims to achieve and maintain an inflation rate between 1% and 3% over the medium term, with a focus to keep it near the 2% mid-point. To this end, the bank sets an appropriate level of interest rates. When inflation is too high, the RBNZ will increase interest rates to cool the economy, but the move will also make bond yields higher, increasing investors’ appeal to invest in the country and thus boosting NZD. On the contrary, lower interest rates tend to weaken NZD. The so-called rate differential, or how rates in New Zealand are or are expected to be compared to the ones set by the US Federal Reserve, can also play a key role in moving the NZD/USD pair.
Macroeconomic data releases in New Zealand are key to assess the state of the economy and can impact the New Zealand Dollar’s (NZD) valuation. A strong economy, based on high economic growth, low unemployment and high confidence is good for NZD. High economic growth attracts foreign investment and may encourage the Reserve Bank of New Zealand to increase interest rates, if this economic strength comes together with elevated inflation. Conversely, if economic data is weak, NZD is likely to depreciate.
The New Zealand Dollar (NZD) tends to strengthen during risk-on periods, or when investors perceive that broader market risks are low and are optimistic about growth. This tends to lead to a more favorable outlook for commodities and so-called ‘commodity currencies’ such as the Kiwi. Conversely, NZD tends to weaken at times of market turbulence or economic uncertainty as investors tend to sell higher-risk assets and flee to the more-stable safe havens.

Acuity Trading
Acuity Trading 是一家成立于 2013 年、总部位于伦敦的金融科技公司,专注于 AI 驱动的另类数据和情绪分析,用于交易与投资。他们以可视化新闻和情绪工具革新在线交易体验,如今持续以最新的 AI 研究与技术提供可产生阿尔法的另类数据与高度互动的交易工具。
Read More


