
Trade The World
NZD/USD Price Forecast: Falls toward 0.5600 after pulling back from nine-day EMA
作者 Akhtar Faruqui
发布日期: 19 Nov 2025 | 修改日期: 19 Nov 2025


POPULAR ARTICLES

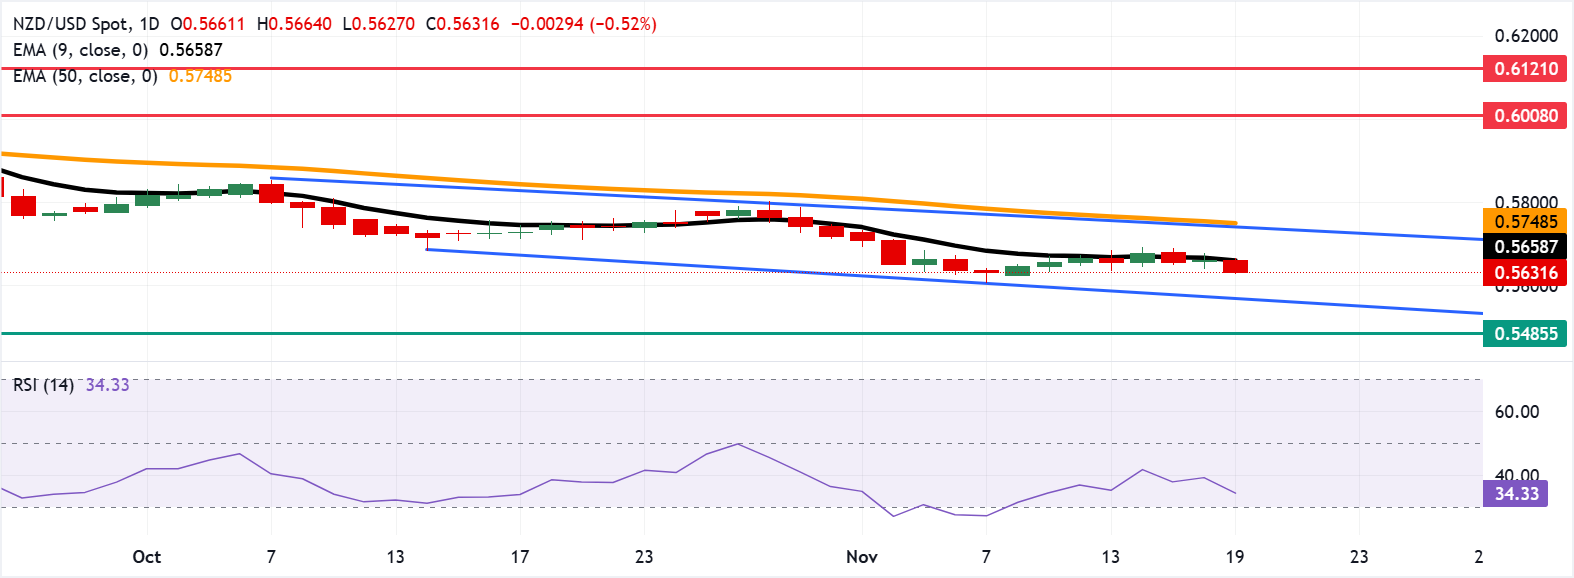
NZD/USD depreciates more than 0.5% after registering modest gains in the previous session, trading around 0.5630 during the European hours on Wednesday. The daily chart’s technical analysis signals a persistent bearish bias as the pair price remains within the descending channel pattern.
- NZD/USD may find primary support at the psychological level of 0.5600.
- The 14-day Relative Strength Index is positioned above the 30 mark, indicating a persistent bearish bias.
- The initial resistance lies at the crucial level of 0.5650, near the nine-day EMA of 0.5658.
NZD/USD depreciates more than 0.5% after registering modest gains in the previous session, trading around 0.5630 during the European hours on Wednesday. The daily chart’s technical analysis signals a persistent bearish bias as the pair price remains within the descending channel pattern.
The 14-day Relative Strength Index (RSI) is positioned slightly above the 30 mark, strengthening the bearish bias. Further decline below the 30 level would indicate an oversold territory and a potential for an upward correction. The short-term price momentum is weaker as the pair trades below the nine-day Exponential Moving Average (EMA).
On the downside, the NZD/USD pair could find its initial support at the psychological level of 0.5600, followed by the lower boundary of the descending channel around 0.5570. A breakout below the channel would reinforce the bearish bias and open the doors for the pair to explore the area around 0.5485, the lowest level since March 2020, which was recorded on April 9, 2025.
The immediate barrier lies at the nine-day EMA of 0.5658. A break above this level would improve the short-term price momentum and support the NZD/USD pair to approach the upper boundary of the descending channel around 0.5740, followed by the 50-day EMA at 0.5748. Further advances would improve the medium-term price momentum and lead the pair to navigate the region around the three-month high of 0.6008, reached on September 17.
New Zealand Dollar Price Today
The table below shows the percentage change of New Zealand Dollar (NZD) against listed major currencies today. New Zealand Dollar was the strongest against the Australian Dollar.
| USD | EUR | GBP | JPY | CAD | AUD | NZD | CHF | |
|---|---|---|---|---|---|---|---|---|
| USD | 0.02% | 0.08% | 0.03% | 0.16% | 0.44% | 0.52% | 0.01% | |
| EUR | -0.02% | 0.06% | 0.00% | 0.13% | 0.41% | 0.50% | -0.01% | |
| GBP | -0.08% | -0.06% | -0.06% | 0.07% | 0.35% | 0.43% | -0.07% | |
| JPY | -0.03% | 0.00% | 0.06% | 0.13% | 0.41% | 0.48% | -0.01% | |
| CAD | -0.16% | -0.13% | -0.07% | -0.13% | 0.28% | 0.35% | -0.14% | |
| AUD | -0.44% | -0.41% | -0.35% | -0.41% | -0.28% | 0.09% | -0.41% | |
| NZD | -0.52% | -0.50% | -0.43% | -0.48% | -0.35% | -0.09% | -0.51% | |
| CHF | -0.01% | 0.00% | 0.07% | 0.01% | 0.14% | 0.41% | 0.51% |
The heat map shows percentage changes of major currencies against each other. The base currency is picked from the left column, while the quote currency is picked from the top row. For example, if you pick the New Zealand Dollar from the left column and move along the horizontal line to the US Dollar, the percentage change displayed in the box will represent NZD (base)/USD (quote).

Acuity Trading
Acuity Trading 是一家成立于 2013 年、总部位于伦敦的金融科技公司,专注于 AI 驱动的另类数据和情绪分析,用于交易与投资。他们以可视化新闻和情绪工具革新在线交易体验,如今持续以最新的 AI 研究与技术提供可产生阿尔法的另类数据与高度互动的交易工具。
Read More


