
NZD/USD Price Forecast: Hovers around 0.6000 near nine-day EMA
作者 Akhtar Faruqui
发布日期: 27 Feb 2026 | 修改日期: 27 Feb 2026


热门文章

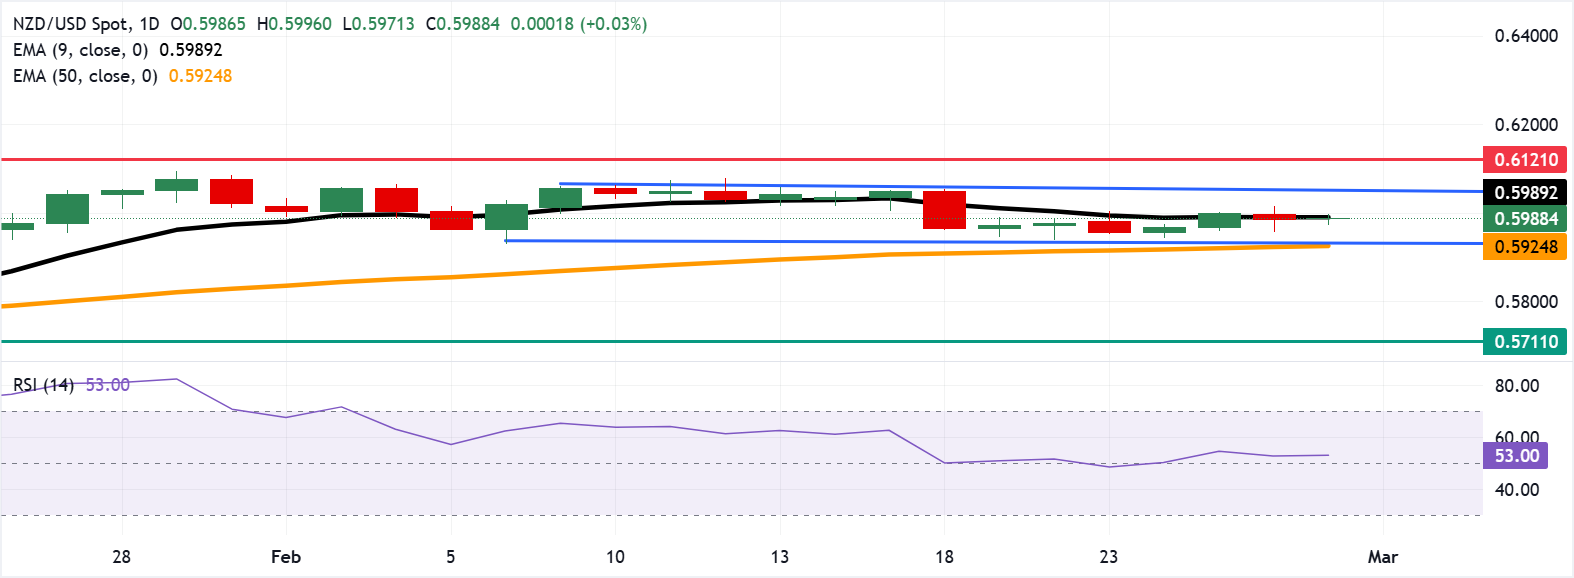
NZD/USD remains steady after registering modest losses in the previous session, trading around 0.5990 during the European hours on Friday. The technical analysis of the daily chart signals a neutral bias, and the pair is consolidating within a horizontal channel.
- NZD/USD may approach the upper horizontal channel boundary around 0.6060.
- The 14-day Relative Strength Index near 53 signals mild upside pressure after easing from overbought levels.
- A close below the nine-day EMA would strengthen downside momentum toward the 0.5930 horizontal channel support.
NZD/USD remains steady after registering modest losses in the previous session, trading around 0.5990 during the European hours on Friday. The technical analysis of the daily chart signals a neutral bias, and the pair is consolidating within a horizontal channel.
Additionally, the 14-day Relative Strength Index (RSI) around 53 sits just above the midline, indicating only mild upside pressure after cooling from overbought conditions earlier in the month. The recent inability to extend gains toward the upper horizontal resistance suggests buyers retain control but lack the conviction seen in the prior impulsive leg higher.
The NZD/USD pair holds above its rising 50-day Exponential Moving Average (EMA) while clinging to the flattened nine-day average at 0.5989, keeping a modest bullish bias intact but with fading momentum.
As long as price holds above this support band and the 50-day average, pullbacks would remain corrective within the prevailing bullish structure around the upper boundary of the horizontal channel around 0.6060. A break above the channel would support the pair to approach the 16-month high of 0.6121, which was recorded in July 2025.
A daily close below the nine-day EMA would reinforce downside momentum, exposing NZD/USD pair to initial support near 0.5930 at the lower channel boundary, which aligns with the 50-day EMA at 0.5924. A break below the medium-term average would put downward pressure on the pair to navigate the region around an almost three-month low of 0.5711.
(The technical analysis of this story was written with the help of an AI tool.)
New Zealand Dollar Price Today
The table below shows the percentage change of New Zealand Dollar (NZD) against listed major currencies today. New Zealand Dollar was the strongest against the British Pound.
| USD | EUR | GBP | JPY | CAD | AUD | NZD | CHF | |
|---|---|---|---|---|---|---|---|---|
| USD | -0.14% | 0.01% | 0.00% | -0.06% | -0.19% | -0.07% | -0.13% | |
| EUR | 0.14% | 0.15% | 0.11% | 0.07% | -0.06% | 0.07% | 0.00% | |
| GBP | -0.01% | -0.15% | -0.04% | -0.08% | -0.21% | -0.08% | -0.14% | |
| JPY | 0.00% | -0.11% | 0.04% | -0.02% | -0.15% | -0.03% | -0.09% | |
| CAD | 0.06% | -0.07% | 0.08% | 0.02% | -0.13% | -0.01% | -0.06% | |
| AUD | 0.19% | 0.06% | 0.21% | 0.15% | 0.13% | 0.12% | 0.06% | |
| NZD | 0.07% | -0.07% | 0.08% | 0.03% | 0.01% | -0.12% | -0.06% | |
| CHF | 0.13% | -0.01% | 0.14% | 0.09% | 0.06% | -0.06% | 0.06% |
The heat map shows percentage changes of major currencies against each other. The base currency is picked from the left column, while the quote currency is picked from the top row. For example, if you pick the New Zealand Dollar from the left column and move along the horizontal line to the US Dollar, the percentage change displayed in the box will represent NZD (base)/USD (quote).

Acuity Trading 是一家成立于 2013 年、总部位于伦敦的金融科技公司,专注于 AI 驱动的另类数据和情绪分析,用于交易与投资。他们以可视化新闻和情绪工具革新在线交易体验,如今持续以最新的 AI 研究与技术提供可产生阿尔法的另类数据与高度互动的交易工具。
阅读更多


