
Trade The World
XRP shows signs of recovery to $3.00 amid ETF inflows and rising retail demand
作者 John Isige
发布日期: 6 Jan 2026 | 修改日期: 6 Jan 2026


POPULAR ARTICLES

Ripple (XRP) is showing strength, trading at $2.36 at the time of writing on Tuesday. The cross-border remittance token has maintained a steady uptrend for six consecutive days, underscoring steady inflows into XRP spot Exchange Traded Funds (ETFs).
- XRP is on the verge of a 28% breakout to $3.00, supported by increasing risk appetite from retail and institutional investors.
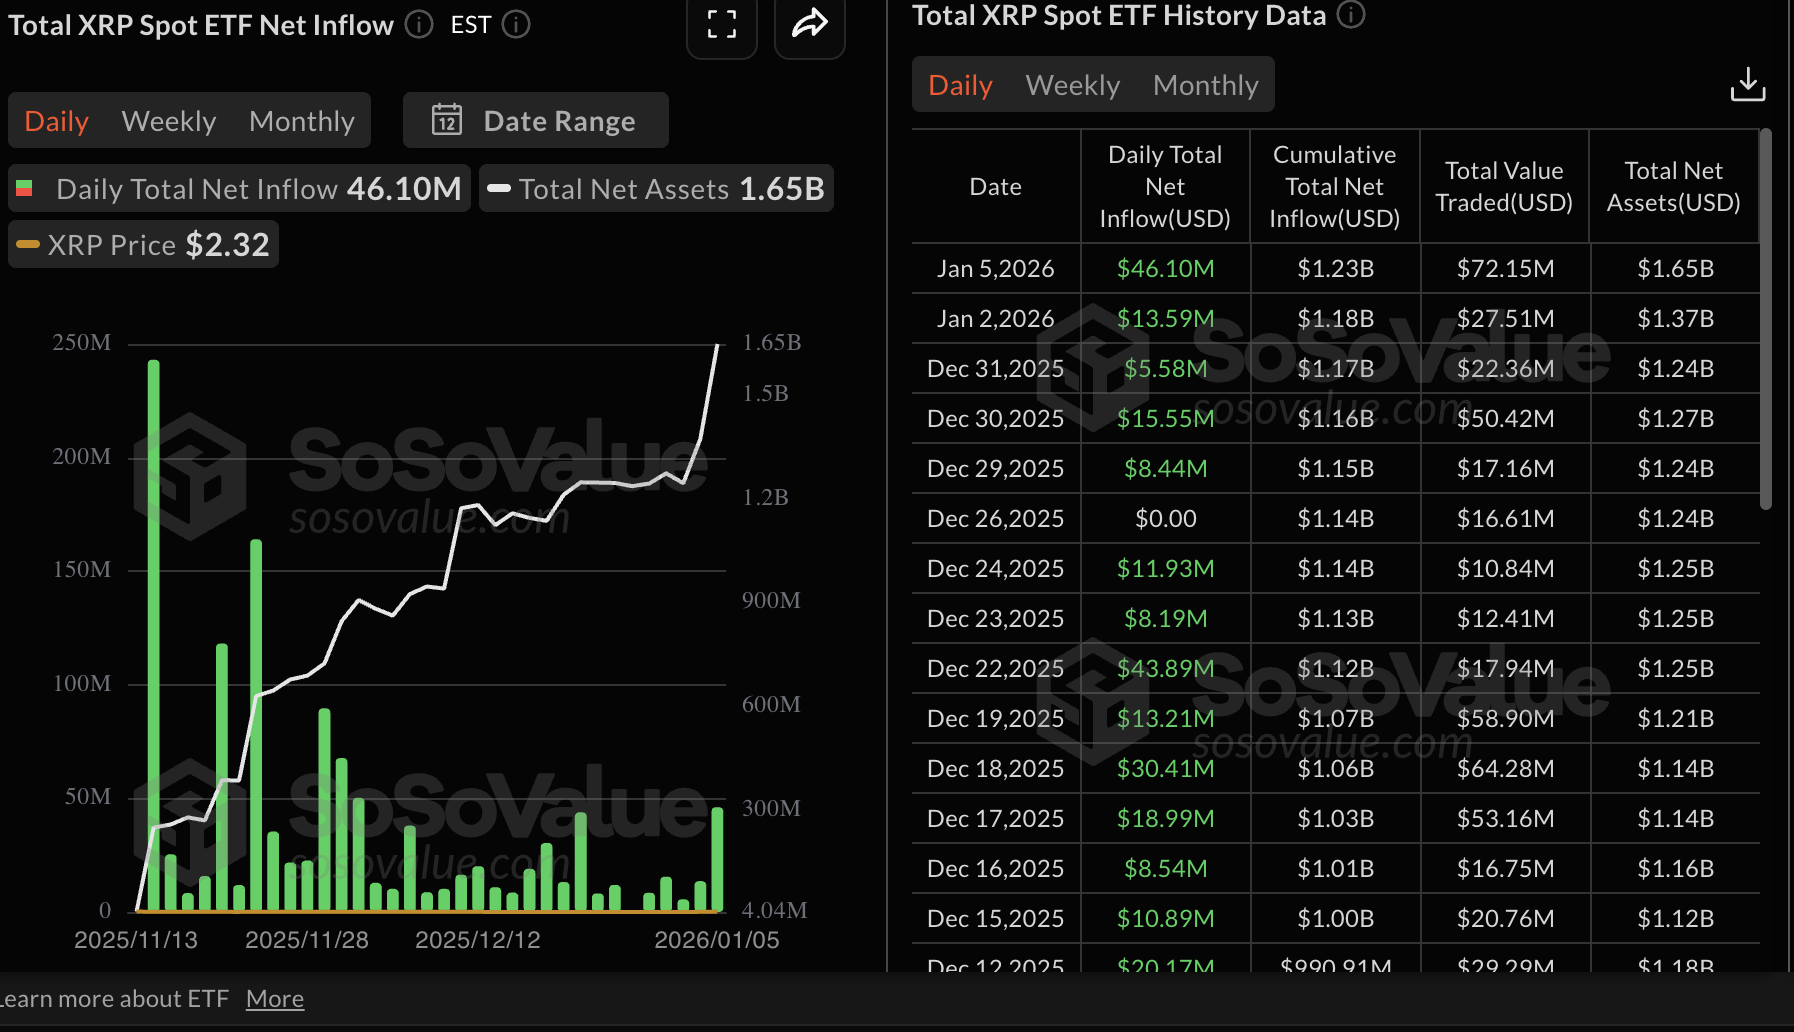
- XRP ETF inflows surge to $46 million on Monday, rising in tandem with futures Open Interest.
- XRP bulls maintain an edge over the bears, backed by a MACD buy signal, while key moving averages offer support.
Ripple (XRP) is showing strength, trading at $2.36 at the time of writing on Tuesday. The cross-border remittance token has maintained a steady uptrend for six consecutive days, underscoring steady inflows into XRP spot Exchange Traded Funds (ETFs).
A break above a multi-month trendline could boost XRP’s chances to extend the trend toward the pivotal $3.00 level, especially with retail demand making a comeback.
XRP gains ground as ETF inflows persist
Inflows into spot XRP ETFs listed in the United States (US) surged to $46 million on Monday, extending the bullish streak from approximately $13.6 million on Friday. SoSoValue data shows that interest in the five XRP ETF products remains steady, with the cumulative inflow at $1.23 billion and net assets at $1.65 billion.
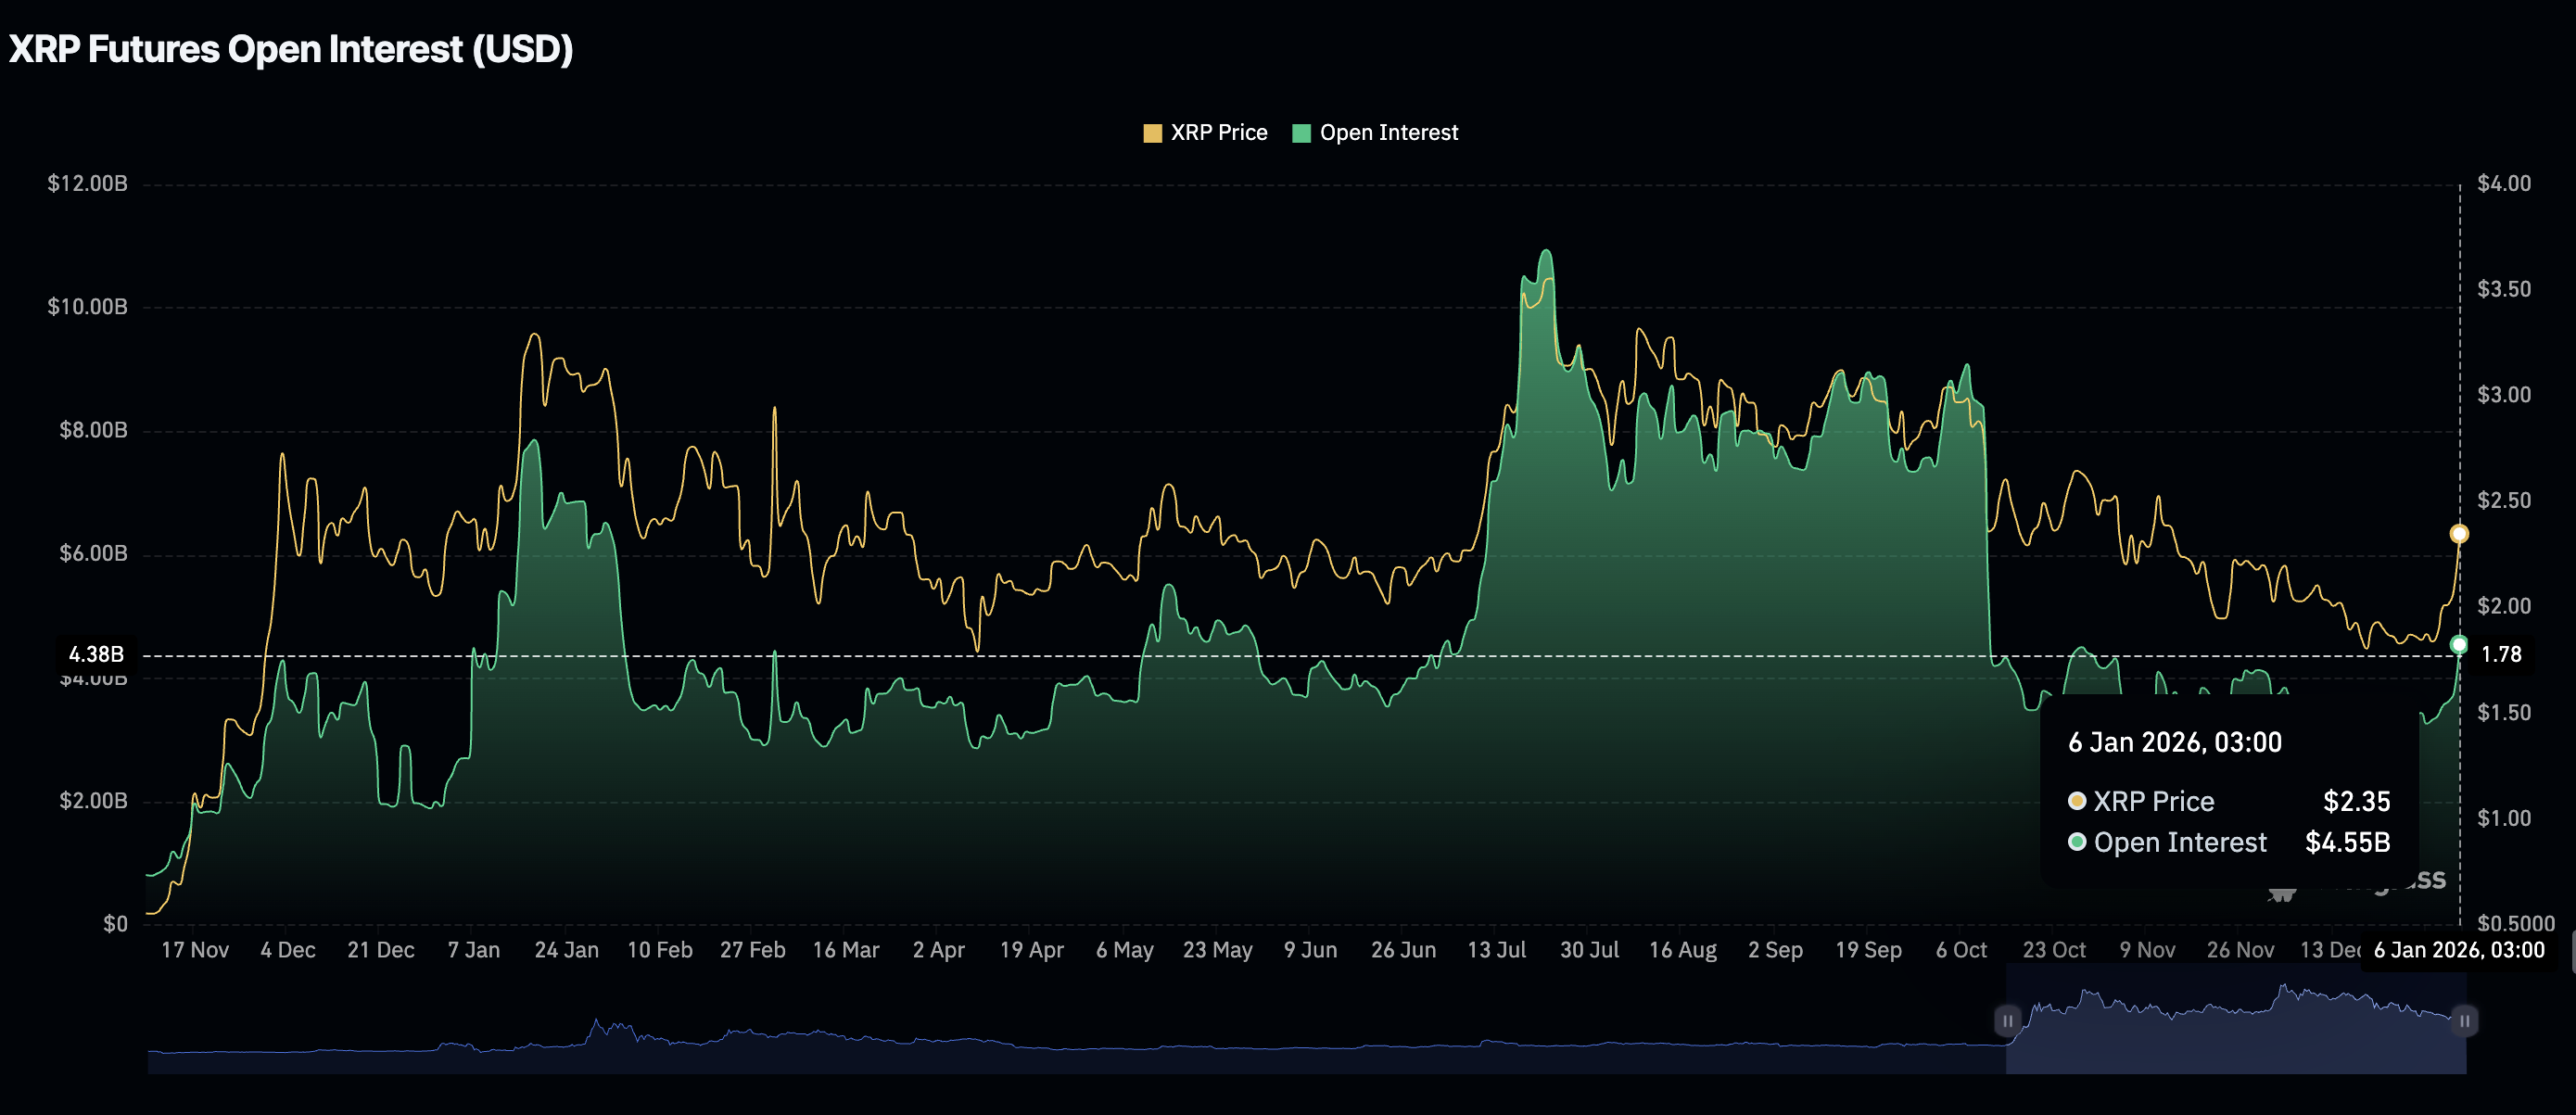
The XRP derivatives market, on the other hand, is also experiencing a resurgence in retail demand, which has spurred growth in futures Open Interest (OI). CoinGlass data shows the OI, which represents the notional value of outstanding futures contracts, averaging $4.55 billion on Tuesday, from $3.77 billion on Monday.
When retail and institutional demand increase simultaneously, the odds of a steady uptrend surge. A steadily rising OI indicates that traders are increasing risk exposure, leaning on optimism for short-term growth in the XRP price.
Technical outlook: XRP eyes potential breakout to $3.00
XRP is trading above the 200-day Exponential Moving Average (EMA), which sits at $2.35 at the time of writing on Tuesday. Although a descending trendline from the record high of $3.66 caps the immediate upside, key technical indicators, including the Moving Average Convergence Divergence (MACD) on the daily chart, support XRP’s bullish outlook.
The blue MACD line has maintained a positive divergence above the red signal line since Wednesday, while the expanding green histogram bars signal increasing bullish momentum.
A close above the 200-day EMA and by extension the descending trendline would support the uptrend’s continuation toward $3,00. Such a breakout would mark a 28% increase from the prevailing market level.

Still, the Relative Strength Index (RSI) at 75 on the same daily chart indicates that XRP is mildly overbought, which could prompt investors to take profits.
A decline in the RSI into the bullish region could trigger a surge in overhead pressure, potentially sending XRP to test the 100-day EMA at $2.22 and the 50-day EMA at $2.07. Further movement below these moving averages could resume the downtrend, targeting November and April lows of $1.77 and $1.66, respectively.
Cryptocurrency metrics FAQs
The developer or creator of each cryptocurrency decides on the total number of tokens that can be minted or issued. Only a certain number of these assets can be minted by mining, staking or other mechanisms. This is defined by the algorithm of the underlying blockchain technology. On the other hand, circulating supply can also be decreased via actions such as burning tokens, or mistakenly sending assets to addresses of other incompatible blockchains.
Market capitalization is the result of multiplying the circulating supply of a certain asset by the asset’s current market value.
Trading volume refers to the total number of tokens for a specific asset that has been transacted or exchanged between buyers and sellers within set trading hours, for example, 24 hours. It is used to gauge market sentiment, this metric combines all volumes on centralized exchanges and decentralized exchanges. Increasing trading volume often denotes the demand for a certain asset as more people are buying and selling the cryptocurrency.
Funding rates are a concept designed to encourage traders to take positions and ensure perpetual contract prices match spot markets. It defines a mechanism by exchanges to ensure that future prices and index prices periodic payments regularly converge. When the funding rate is positive, the price of the perpetual contract is higher than the mark price. This means traders who are bullish and have opened long positions pay traders who are in short positions. On the other hand, a negative funding rate means perpetual prices are below the mark price, and hence traders with short positions pay traders who have opened long positions.

Acuity Trading
Acuity Trading 是一家成立于 2013 年、总部位于伦敦的金融科技公司,专注于 AI 驱动的另类数据和情绪分析,用于交易与投资。他们以可视化新闻和情绪工具革新在线交易体验,如今持续以最新的 AI 研究与技术提供可产生阿尔法的另类数据与高度互动的交易工具。
Read More


