
XRP steadies above $1.90 support as ETFs inflows signal bullish shift
作者 John Isige
发布日期: 22 Jan 2026 | 修改日期: 22 Jan 2026


热门文章

Ripple (XRP) is consolidating above $1.90, a short-term support level, at the time of writing on Thursday. This mild uptick marks two consecutive days of a strengthening technical outlook, following recent market-wide volatility.
- XRP stabilizes above $1.90 short-term support, but remains below the 50-day EMA resistance.
- XRP Long-Term Holder NUPL on-chain indicator resets, signaling a potential floor price and bullish shift.
- XRP ETFs' inflows resume despite broader market volatility and low retail interest.
Ripple (XRP) is consolidating above $1.90, a short-term support level, at the time of writing on Thursday. This mild uptick marks two consecutive days of a strengthening technical outlook, following recent market-wide volatility.
XRP Long-Term Holder signals fresh accumulation
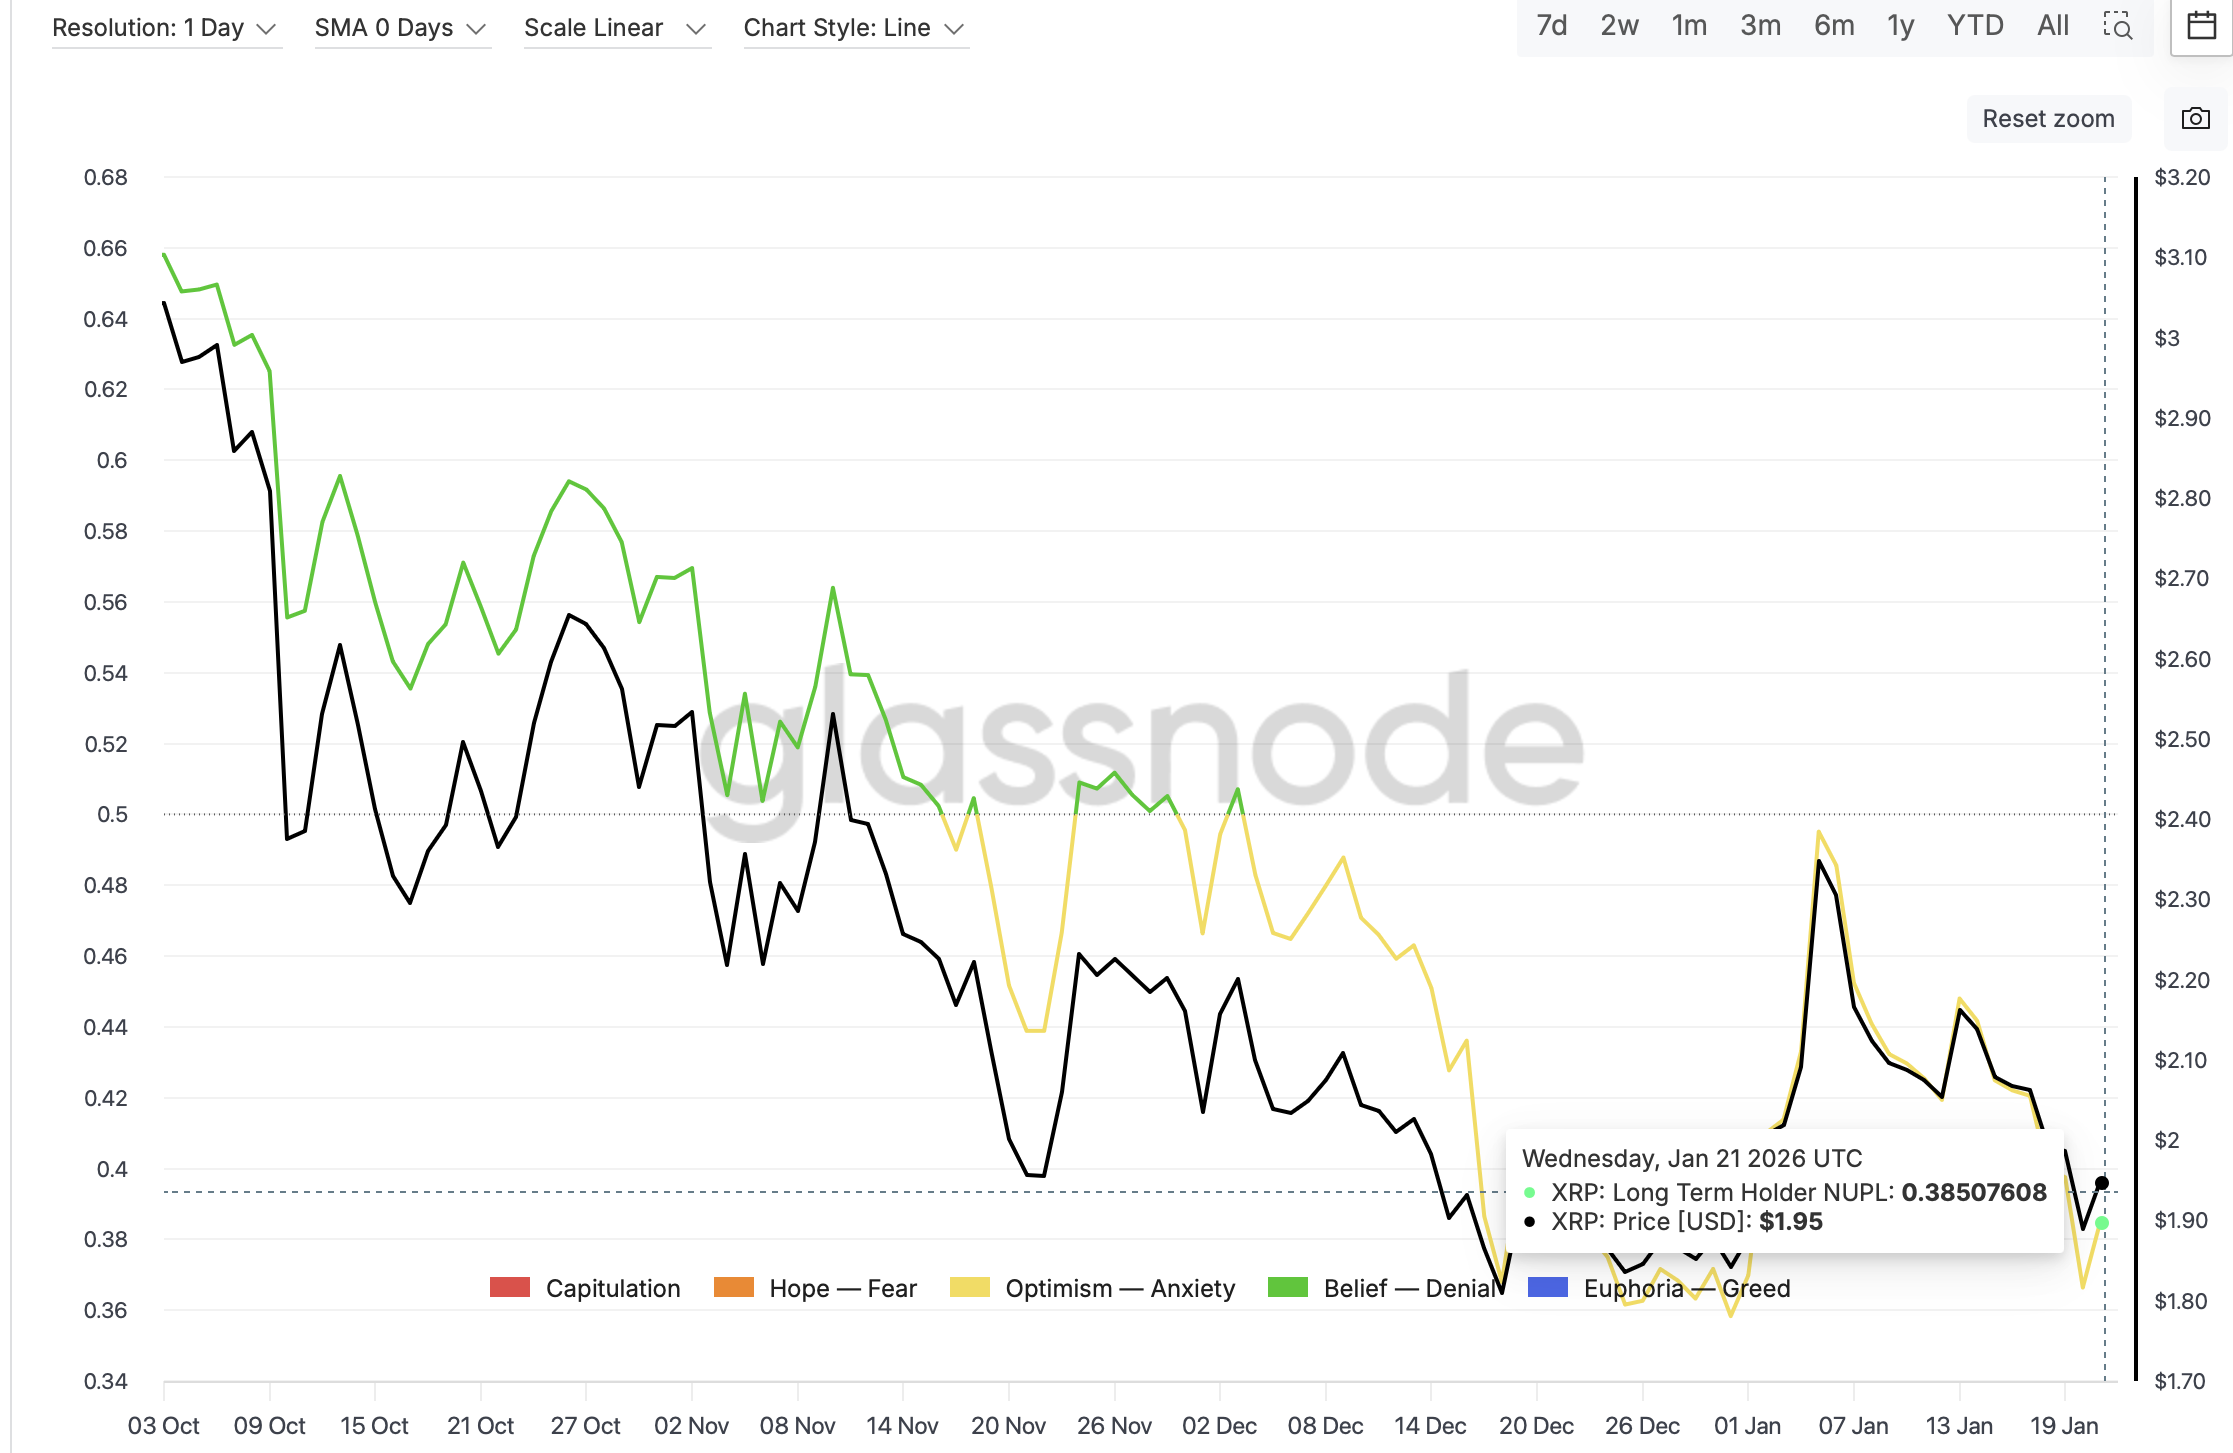
The XRP Long-Term Holder Net Unrealized Profit/Loss (LTH-NUPL) indicator has reset to levels historically associated with accumulation phases and local price floors. Glassnode’s data shows that the LTH-NUPL ratio indicates a transition to optimism at 0.39.
A continued recovery in this metric would keep investors interested in XRP as accumulation drives prices higher. The LTH-NUPL considers transactions with a lifespan of at least 155 days and serves as an indicator of long-term investor behaviour.
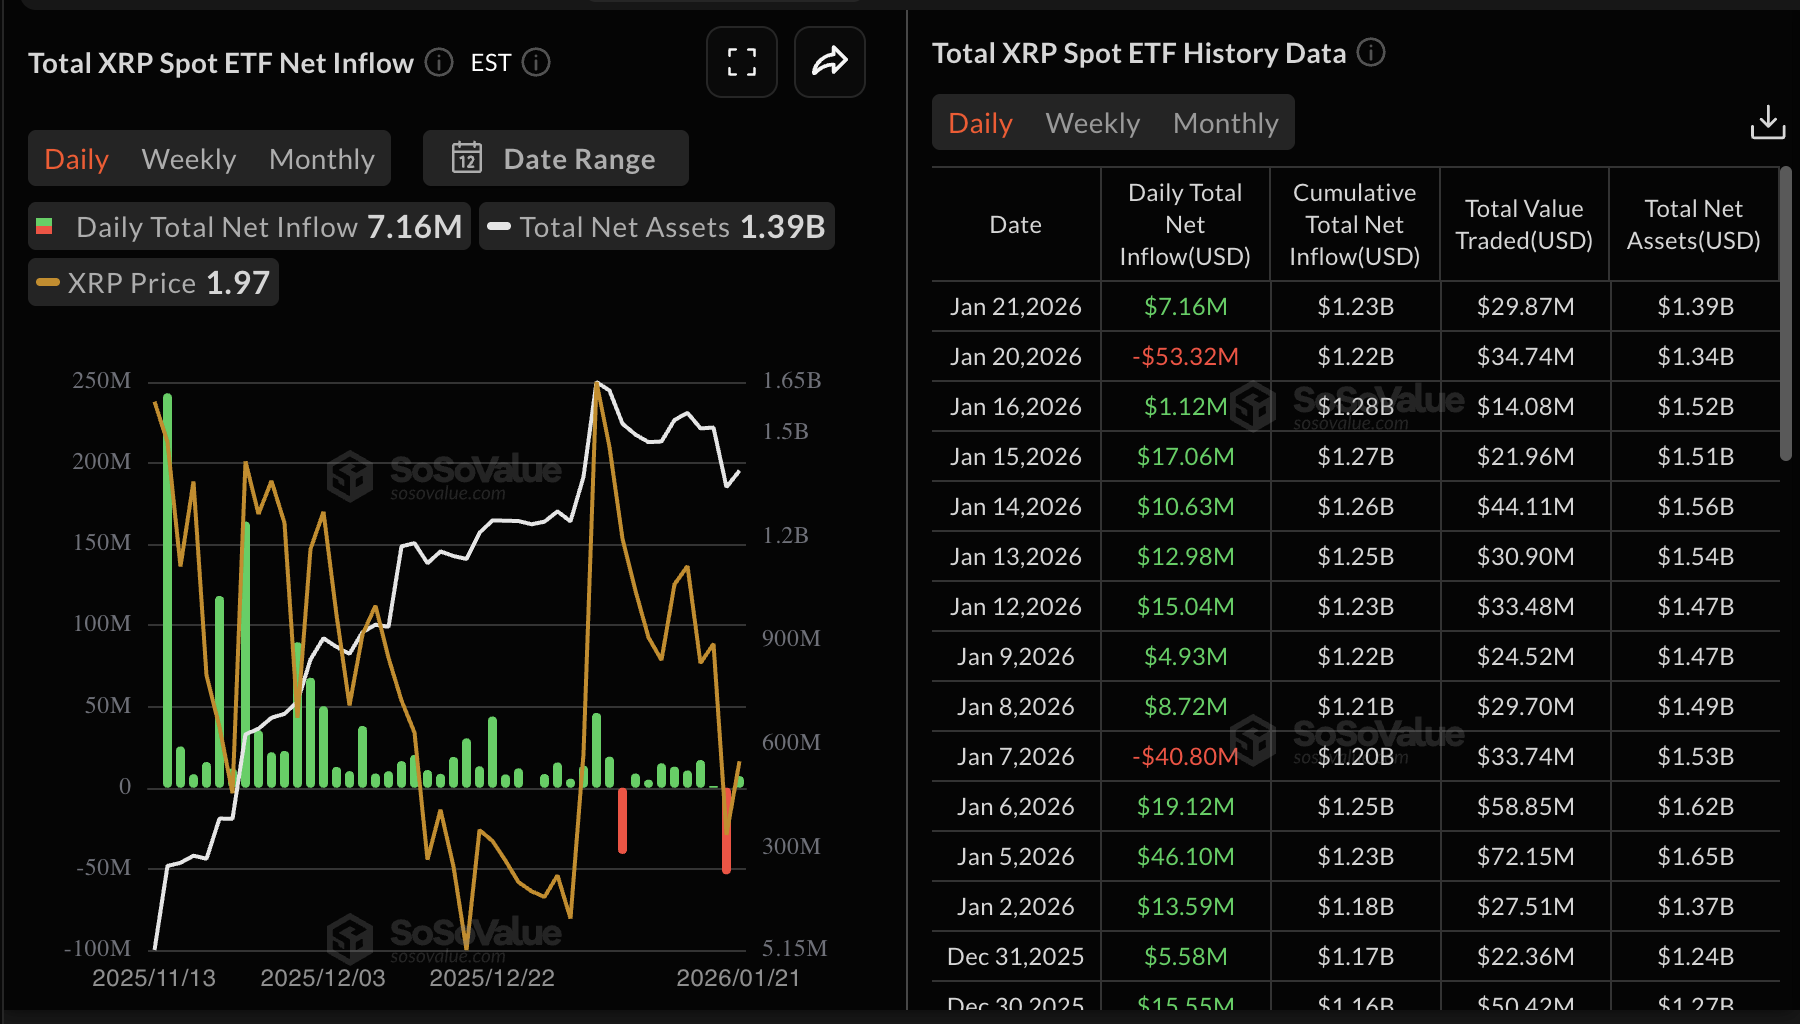
Meanwhile, institutional investors are leaning back into risk, as evidenced by inflows into Exchange Traded Funds (ETFs). SoSoValue data shows approximately $7 million in inflows on Wednesday, led by Bitwise’s XRP ETF with over $5 million and Franklin Templeton’s XRPZ with $1 million. The cumulative total inflow currently stands at $1.23 billion, and the net assets at $1.39 billion.
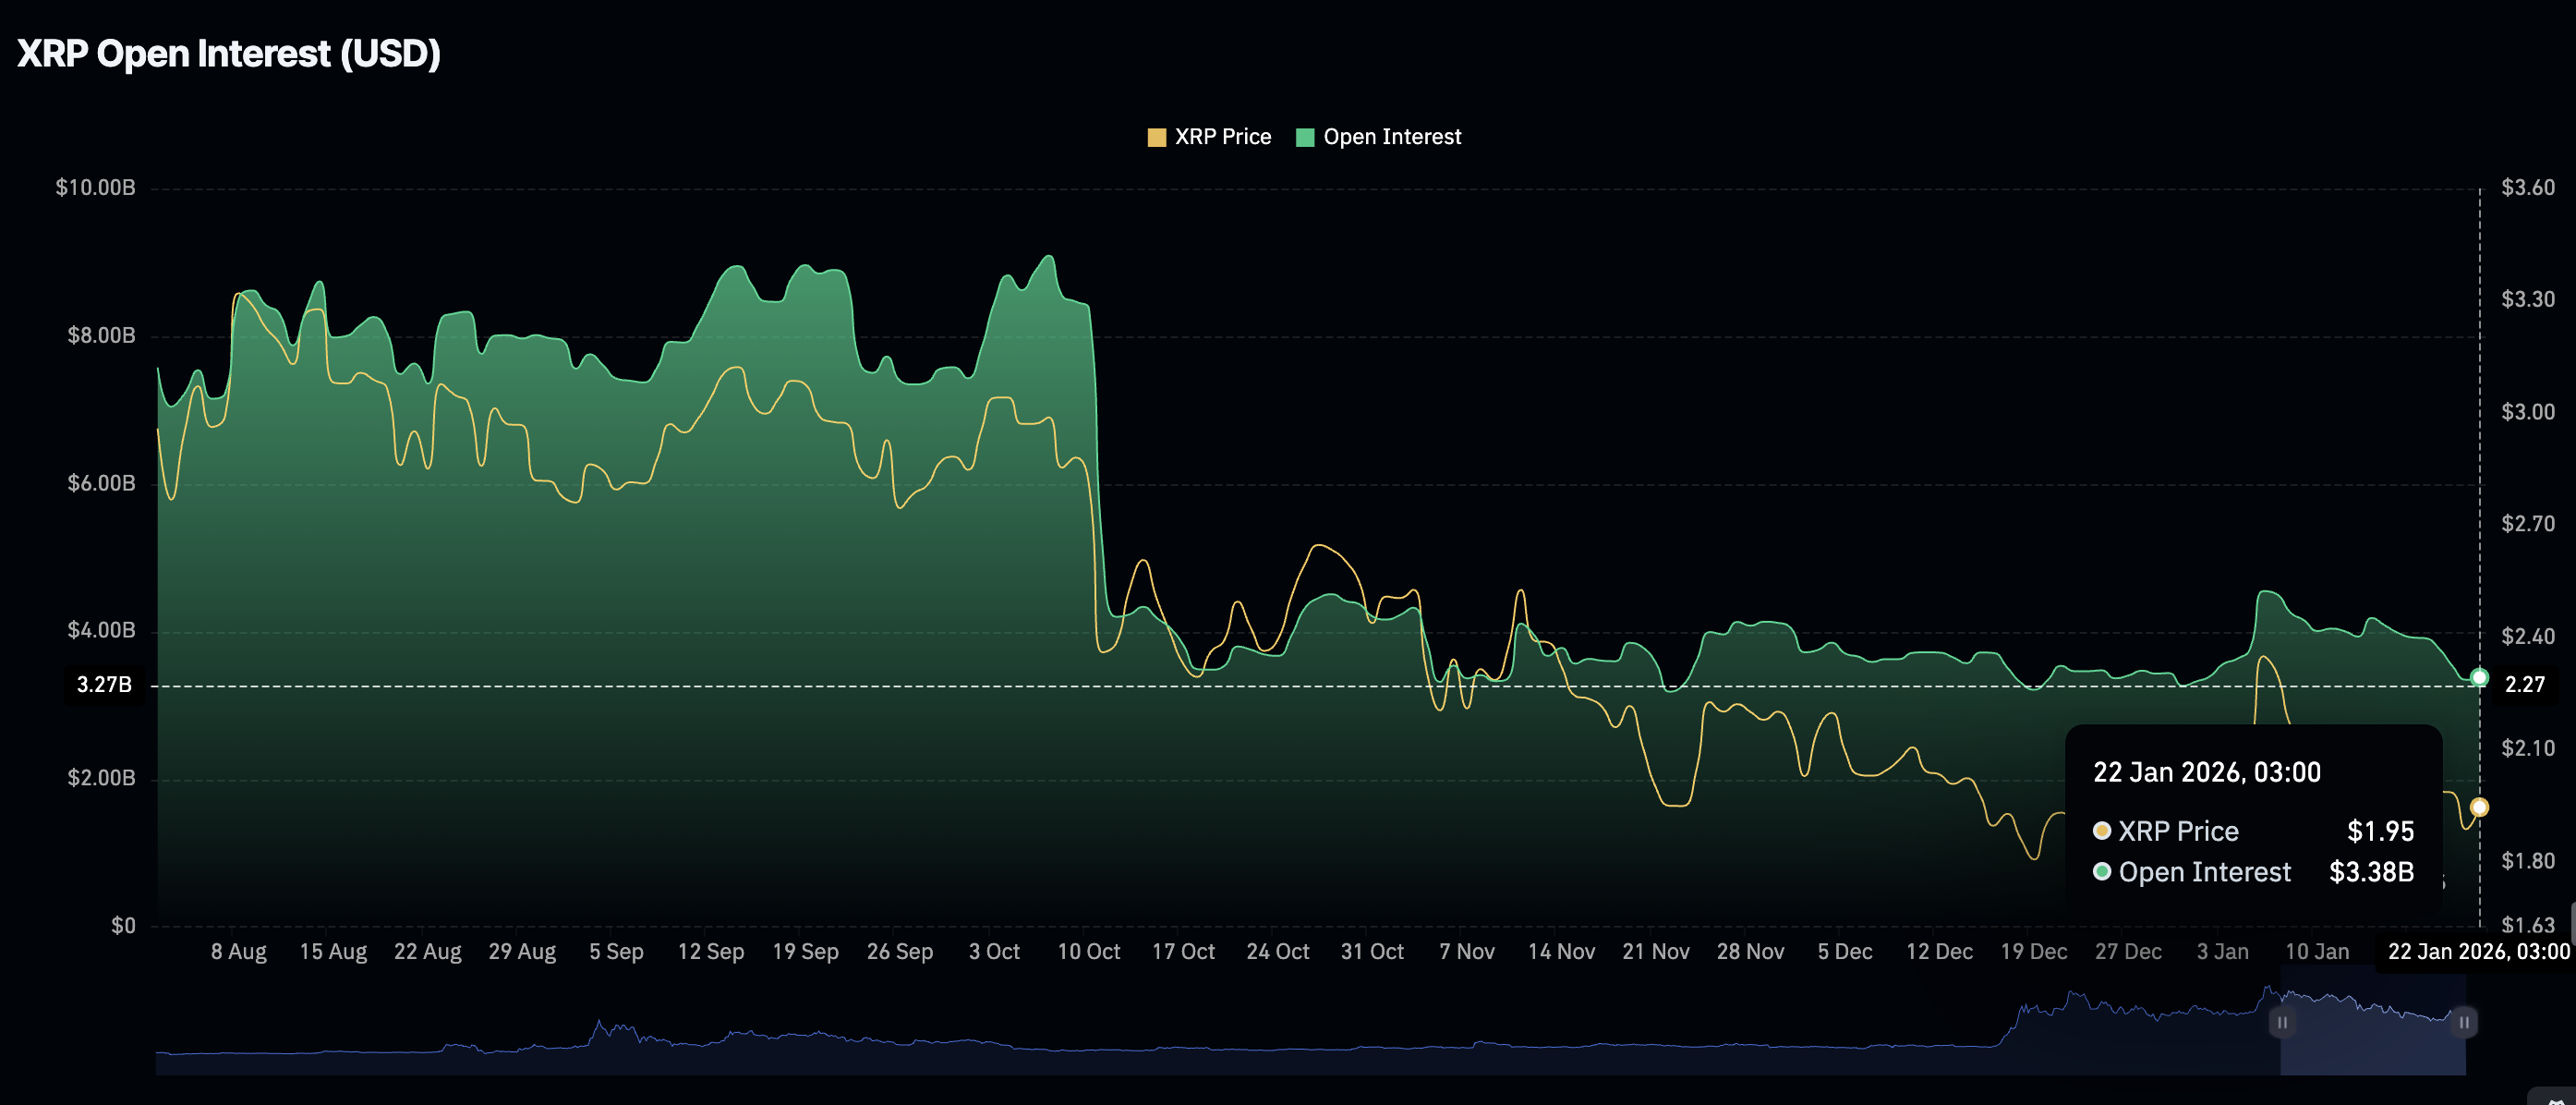
Retail interest in XRP remains largely subdued despite institutional investors leaning back into risk. CoinGlass shows futures Open Interest (OI) averaging $3.38 billion on Thursday, up slightly from $3.35 the previous day. The OI has declined from $4.55 billion recorded on January 6, underlining the prevailing risk-off sentiment. Low retail interest may constrain XRP’s upside.
Technical outlook: XRP defends support amid mixed signals
The Moving Average Convergence Divergence (MACD) indicator remains below the signal line on the daily chart, confirming XRP’s short-term bearish momentum. The histogram bars, which are expanding below the zero line, may prompt investors to reduce exposure, adding to the selling pressure.
Meanwhile, the $1.90 support level remains critical for XRP to sustain bullish momentum and reclaim the $2.00 psychological threshold. Beyond this range, the 50-day Exponential Moving Average (EMA) caps the upside at $2.05, the 100-day EMA at $2.18 and the 200-day EMA at $2.30.
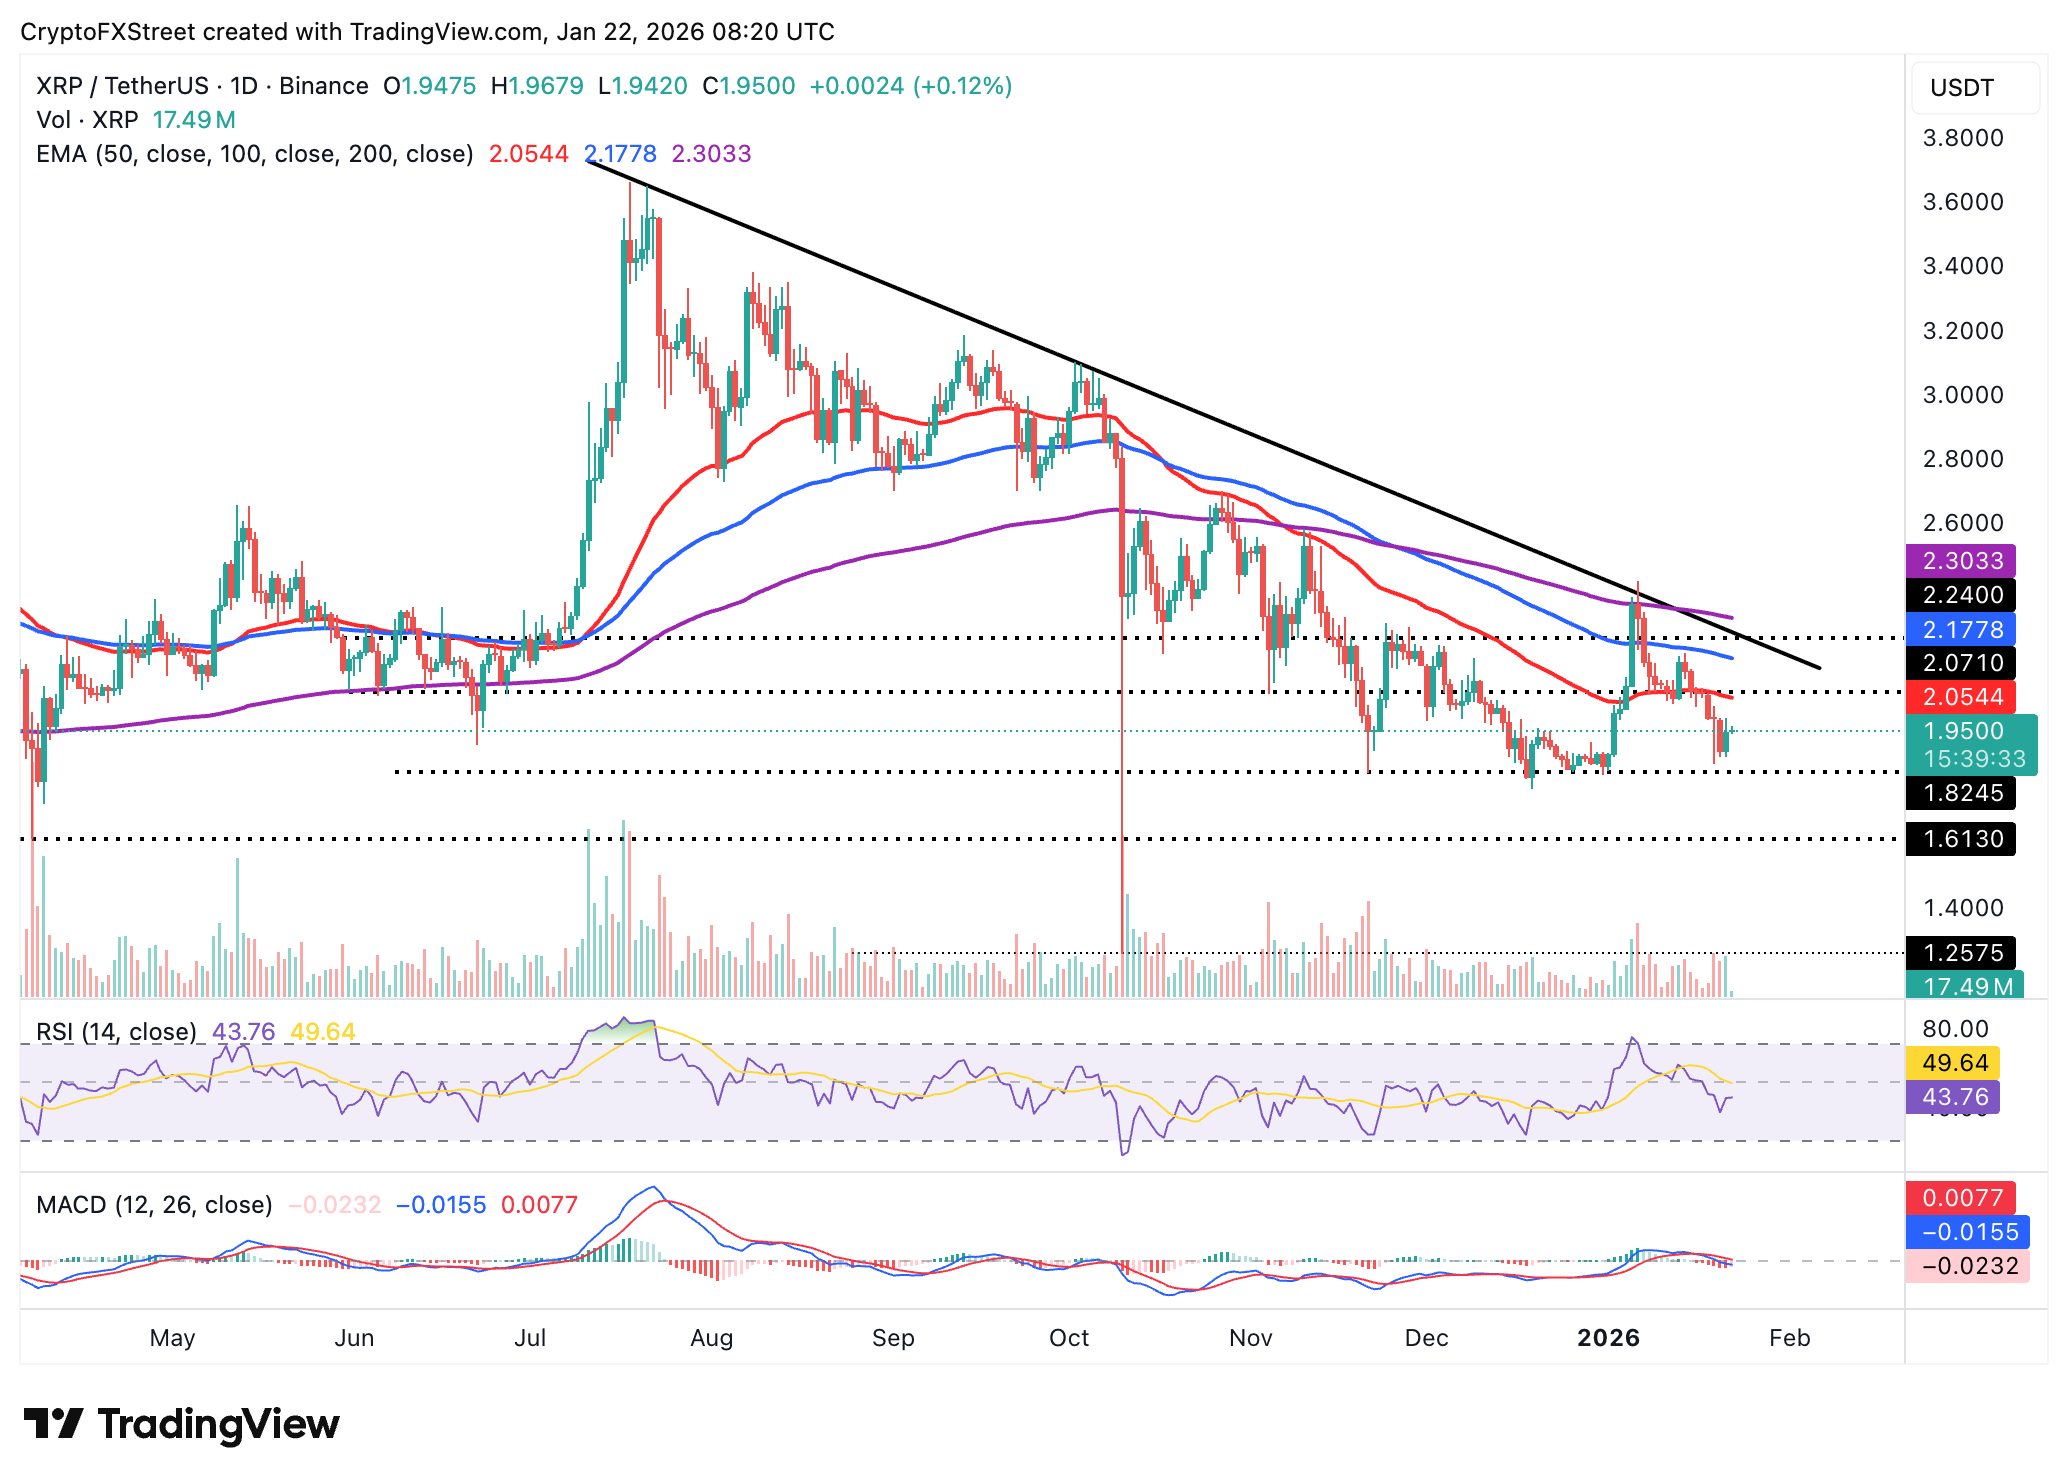
However, the Relative Strength Index (RSI) has risen to 44 on the daily chart, indicating that bearish momentum is fading. A sustained move above the 50 midline would signal a shift from bearish to bullish momentum. Conversely, a daily close below the $1.90 support could accelerate downside pressure toward Monday’s low of $1.85.
Open Interest, funding rate FAQs
Higher Open Interest is associated with higher liquidity and new capital inflow to the market. This is considered the equivalent of increase in efficiency and the ongoing trend continues. When Open Interest decreases, it is considered a sign of liquidation in the market, investors are leaving and the overall demand for an asset is on a decline, fueling a bearish sentiment among investors.
Funding fees bridge the difference between spot prices and prices of futures contracts of an asset by increasing liquidation risks faced by traders. A consistently high and positive funding rate implies there is a bullish sentiment among market participants and there is an expectation of a price hike. A consistently negative funding rate for an asset implies a bearish sentiment, indicating that traders expect the cryptocurrency’s price to fall and a bearish trend reversal is likely to occur.

Acuity Trading 是一家成立于 2013 年、总部位于伦敦的金融科技公司,专注于 AI 驱动的另类数据和情绪分析,用于交易与投资。他们以可视化新闻和情绪工具革新在线交易体验,如今持续以最新的 AI 研究与技术提供可产生阿尔法的另类数据与高度互动的交易工具。
阅读更多


