
Trade The World
Solana Price Forecast: SOL bulls aiming for record highs as on-chain and derivatives data turn positive
作者 Manish Chhetri
发布日期: 6 Oct 2025 | 修改日期: 6 Oct 2025


POPULAR ARTICLES

Solana (SOL) is trading in green above $230 at the time of writing on Monday, having gained nearly 9% in the previous week. Strengthening on-chain metrics and bullish derivative data signal rising investor confidence, with bulls setting their sights on the all-time high near $296.
- Solana price finds support around the daily level at $230, with bulls aiming for an all-time high of $295.83.
- On-chain data support a bullish outlook, as SOL’s TVL and stablecoin market capitalization are increasing, indicating growing investor confidence.
- The derivatives data also suggests a rally continuation as fuding rate is positive and bullish bets are rising.
Solana (SOL) is trading in green above $230 at the time of writing on Monday, having gained nearly 9% in the previous week. Strengthening on-chain metrics and bullish derivative data signal rising investor confidence, with bulls setting their sights on the all-time high near $296.
Investors' growing confidence in SOL
DeFiLlama data shows that Solana's stablecoin market capitalization currently stands at $15.11 billion, a new all-time high, and has been steadily rising since mid-September. Such stablecoin activity and value increase on the SOL project suggest a bullish outlook, as it boosts network usage and can attract more users to the ecosystem, driven by Decentralized Finance (DeFi), meme coins, and payment use cases.
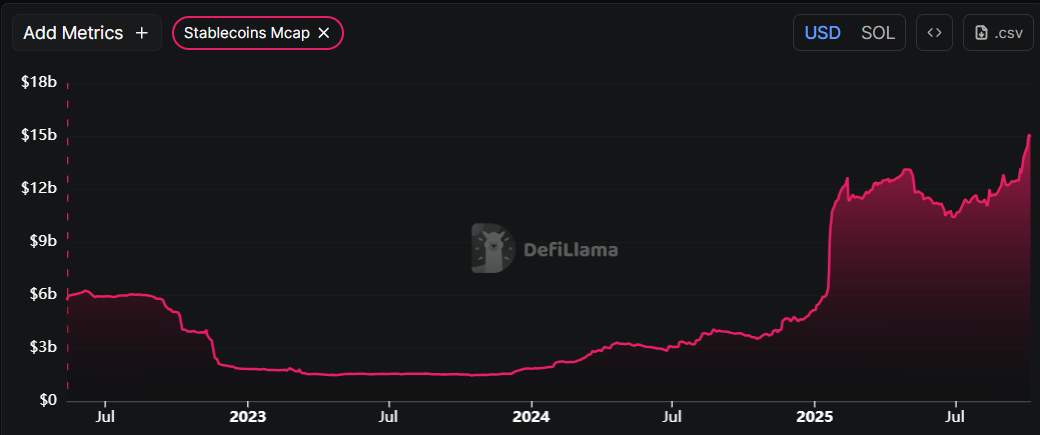
Solana Stablecoins market capitalization chart. Source: DefiLlama
Apart from growing the stablecoins market cap, Solana’s Total Value Locked also rises from $10.78 billion on September 28 to $12.69 billion on Monday, nearing its record highs of $13.02 billion. Rising TVL indicates growing activity and interest within Solana’s ecosystem, suggesting that more users are depositing or utilizing assets within SOL-based protocols.
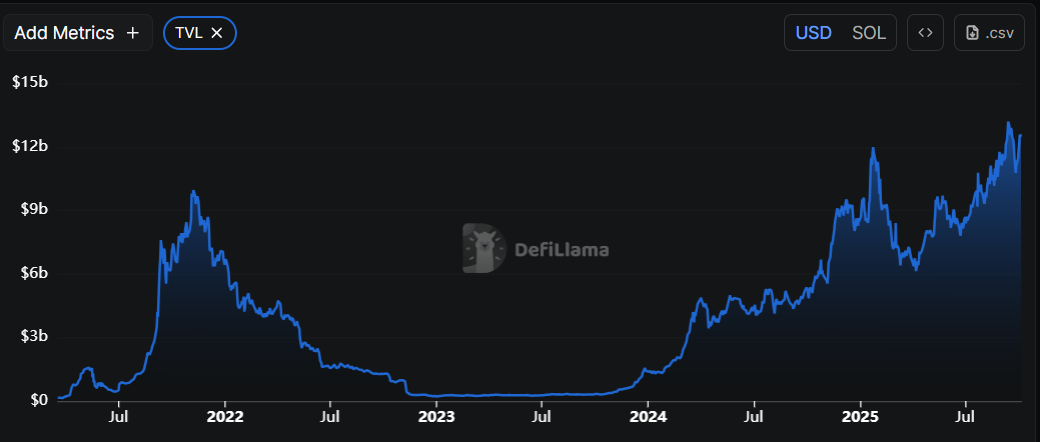
Solana TVL chart. Source: DefiLlama
Solana’s derivatives data show bullish bias
On the derivatives side, Solana further supports the bullish outlook. CoinGlass’s OI-Weighted Funding Rate data shows that the number of traders betting that the price of Solana will slide further is lower than those anticipating a price increase.
The metric has flipped a positive rate on Saturday and reads 0.0052% on Monday, indicating that longs are paying shorts. Historically, as shown in the chart below, when the funding rates have flipped from negative to positive, Solana’s price has rallied sharply.
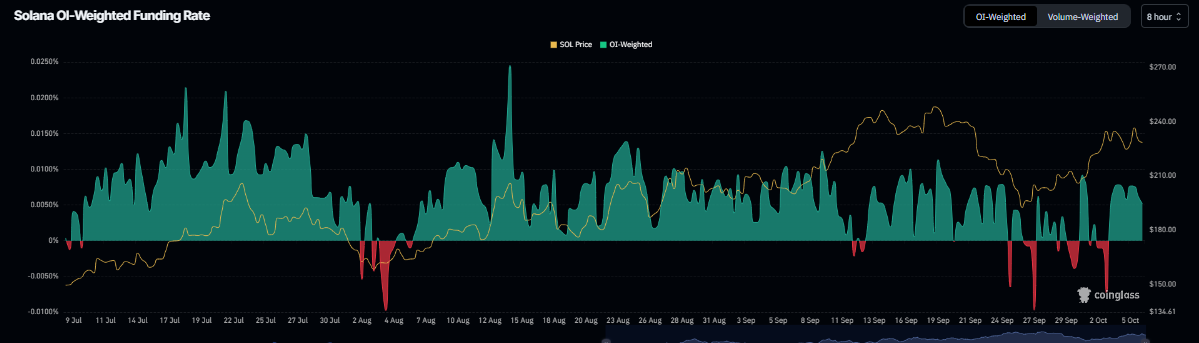
Solana’s funding rate chart. Source: CoinGlass
Additionally, bullish betting on the Solana price to rally has reached its highest level in over a month, further supporting the bullish view.
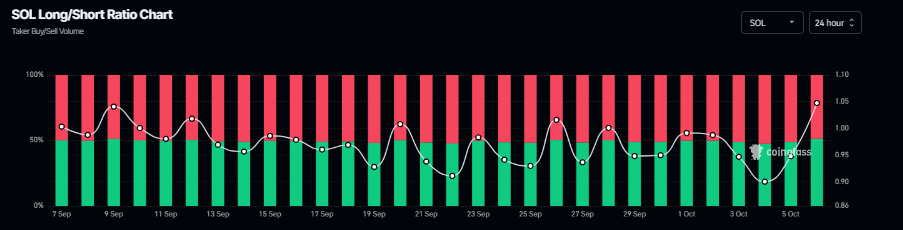
Solana long-to-short ratio chart. Source: CoinGlass
Solana Price Forecast: SOL bulls aiming for record highs
Solana price found support around the 61.8% Fibonacci retracement level at $193.52 on September 26 and rose by 18% by Sunday. At the time of writing on Monday, it trades at around $232.
If the daily support at $230 holds as support, SOL could extend the rally toward the record high of $295.83.
The Relative Strength Index (RSI) on the daily chart reads 57, which is above the neutral level of 50, indicating that bullish momentum is gaining traction. Moreover, the Moving Average Convergence Divergence (MACD) also showed a bullish crossover last week. Additionally, the rising green histogram bars above the neutral level further indicate a bullish momentum and continuation of an upward trend.
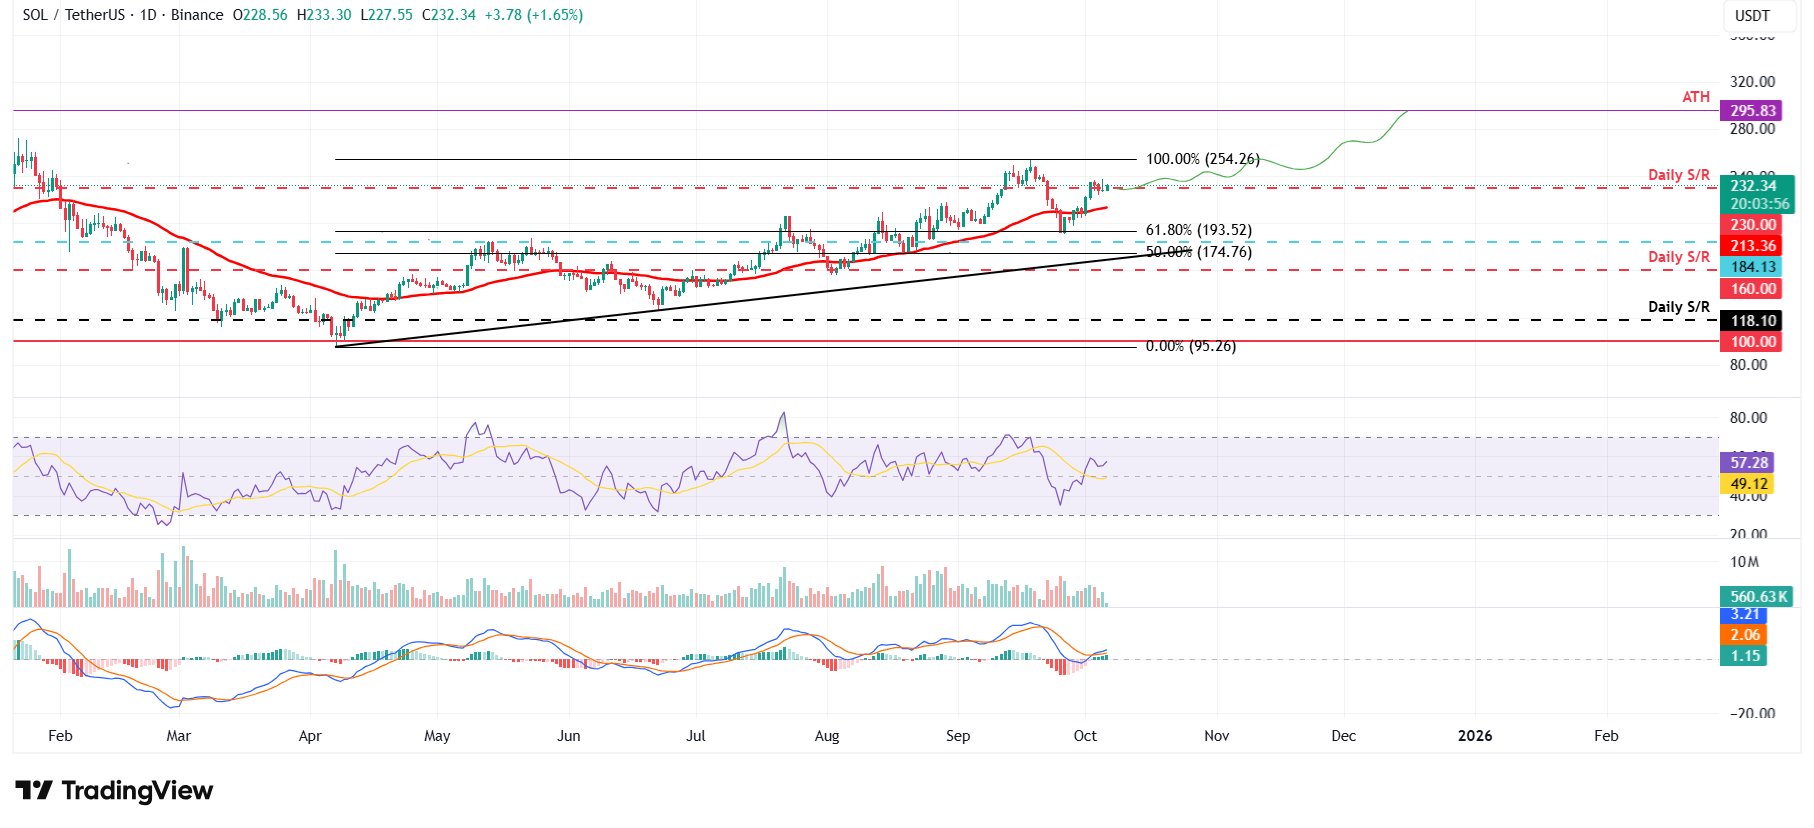
SOL/USDT daily chart
However, if SOL faces a correction, it could extend the decline toward the 50-day Exponential Moving Average (EMA) at $213.36.

Acuity Trading
Acuity Trading 是一家成立于 2013 年、总部位于伦敦的金融科技公司,专注于 AI 驱动的另类数据和情绪分析,用于交易与投资。他们以可视化新闻和情绪工具革新在线交易体验,如今持续以最新的 AI 研究与技术提供可产生阿尔法的另类数据与高度互动的交易工具。
Read More


