
Trade The World
SPX6900 Price Forecast: SPX bears take control, signaling further downside
作者 Manish Chhetri
发布日期: 21 Oct 2025 | 修改日期: 21 Oct 2025


POPULAR ARTICLES

SPX6900 (SPX) price slides down by nearly 5%, trading around $0.98 at the time of writing on Tuesday after facing rejection from a previously broken trendline. The derivatives data projects a bearish sentiment, with SPX’s Open Interest (OI) falling and bearish bets rising among traders.
- SPX6900 price trades in red on Tuesday after facing rejection from a previously broken trendline.
- Derivatives data show falling Open Interest and a rise in bearish positions, suggesting growing downside pressure.
- The technical outlook suggests weakness, with bears targeting a drop toward the $0.81 level.
SPX6900 (SPX) price slides down by nearly 5%, trading around $0.98 at the time of writing on Tuesday after facing rejection from a previously broken trendline. The derivatives data projects a bearish sentiment, with SPX’s Open Interest (OI) falling and bearish bets rising among traders. The technical side further supports a bearish outlook, suggesting that SPX6900 could extend its decline toward the $0.81 level in the upcoming days.
SPX derivatives data show bearish bias
Coinglass’s futures Open Interest for the SPX meme coin drops to $9.94 million on Tuesday, compared to $18.96 million on October 7. This drop in OI, constantly falling since July, signals waning investor participation and reinforces a weakening market sentiment for the SPX meme coin.
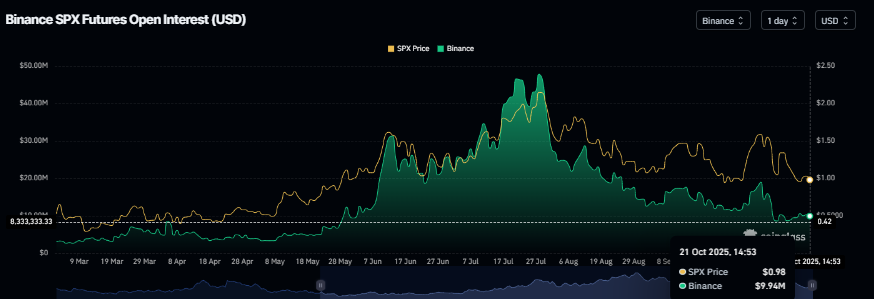
SPX Open Interest chart. Source: Coinglass
Another derivatives metric that strengthens the bearish thesis is CoinGlass’s long-to-short ratio for SPX at 0.86 on Tuesday, the lowest level in over a month, rising bearish bets among traders.
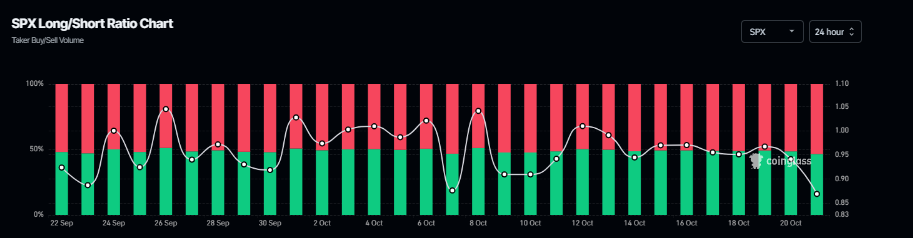
SPX long-to-short ratio chart. Source: Coinglass
SPX6900 Price Forecast: SPX faces rejection from the previously broken trendline
SPX6900 price corrected more than 24% in the previous week after facing rejection around the 50-day Exponential Moving Average (EMA). SPX recovered slightly during the weekend and extended gains on Monday. At the time of writing on Tuesday, SPX trades down by nearly 5% at around $0.98, facing rejection from a previously broken trendline.
If SPX continues its correction, it could extend the decline toward the May 27 low of $0.81.
The Relative Strength Index (RSI) indicator on the daily chart reads 41, below the neutral level of 50, indicating bearish momentum gaining traction. Additionally, the Moving Average Convergence Divergence (MACD) showed a bearish crossover last week, which remains in effect, further supporting the bearish view.
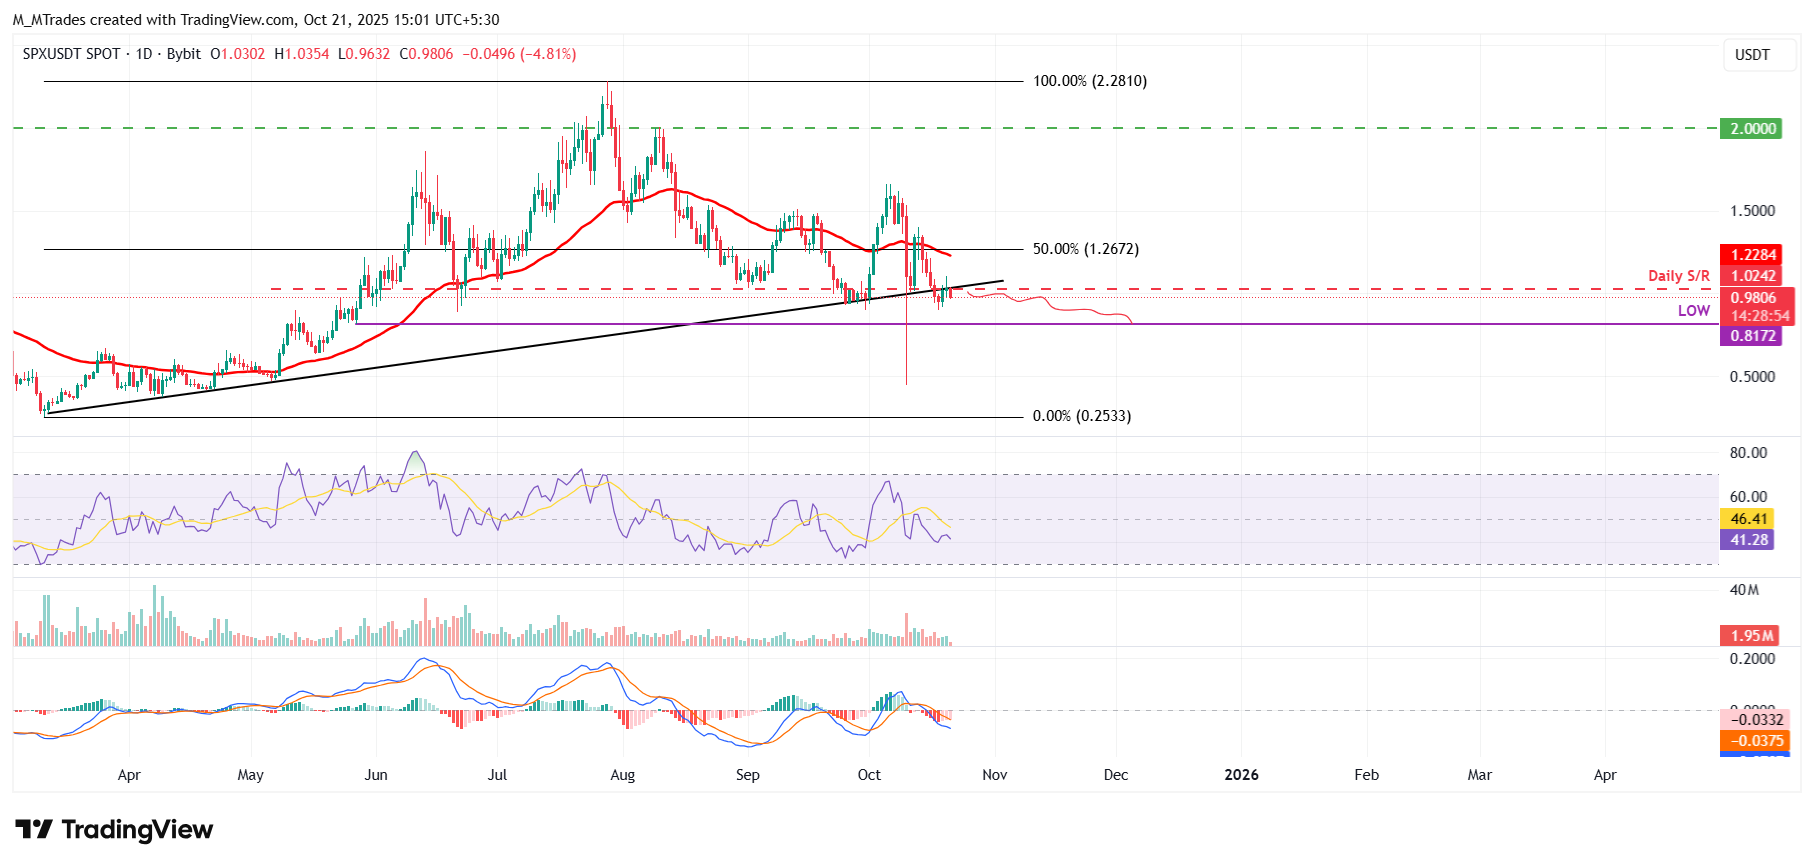
SPX/USDT daily chart
On the other hand, if SPX recovers and closes above the ascending trendline, it could extend the recovery toward the 50-day EMA, currently at $1.22.

Acuity Trading
Acuity Trading 是一家成立于 2013 年、总部位于伦敦的金融科技公司,专注于 AI 驱动的另类数据和情绪分析,用于交易与投资。他们以可视化新闻和情绪工具革新在线交易体验,如今持续以最新的 AI 研究与技术提供可产生阿尔法的另类数据与高度互动的交易工具。
Read More


